|
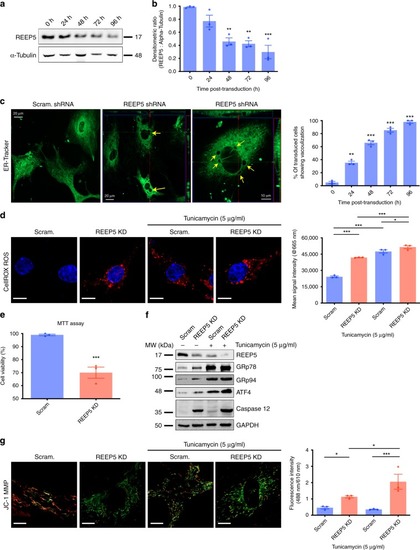
In vitro REEP5 depletion in cardiac myocytes results in SR/ER membrane destabilization and dysfunction.a Immunoblotting analysis of lentiviral-mediated REEP5 depletion in CMNCs at 0, 24, 48, 72, 96 h post transduction. b Quantitative analysis of REEP5 expression levels showed 60% reduction 48 h after REEP5 shRNA transduction. Quantification was done under ×40 objective lens and approximately 40–50 cells were scored for each experimental condition, n = 3 independent biological replicates; data are presented as mean ± SEM. c Confocal imaging of CMNCs stained with ER-tracker showed SR/ER vacuoles (yellow arrows) 48 h post viral transduction. Vacuoles were observed starting 24 h post transduction, peaking after 96 h post lentiviral infection with REEP5 shRNA. Quantification was done under ×40 objective lens and approximately 30–40 cells were scored for each experimental condition, n = 3 independent biological replicates; data are presented as mean ± SEM. d Confocal imaging of CMNCs stained with CellROX oxidative stress dye 48 h post viral transduction with REEP5 shRNA. Scale, 10 μm. Spectrophotometric analysis showed a marked increase in ROS levels following shRNA-mediated REEP5 depletion in the presence and absence of tunicamycin, n = 40–50 cells examined under ×40 objective, n = 3 independent biological replicates; data are presented as mean ± SEM. e Cardiac myocyte cell viability levels 48 h post viral transduction with REEP5 shRNA measured by MTT assay, n = 3 independent biological replicates; data are presented as mean ± SEM. f Immunoblotting analysis of REEP5, ER stress markers (GRp78, GRp94, and ATF4), and ER-dependent apoptosis marker (caspase 12) expression levels upon REEP5 depletion in the presence or absence of tunicamycin. g Confocal imaging of CMNCs stained with mitochondrial membrane potential dye JC-1 48 h post viral transduction with REEP5 shRNA. Scale, 10 μm, n = 40–50 cells examined under ×40 objective lens over 3 independent experiments. Asterisks indicate a statistically significant p value in a Tukey’s multiple comparison analysis where *p < 0.05, **p < 0.01, and ***p < 0.001; data are presented as mean ± SEM. Source data containing original uncropped immunoblots are provided as a Source Data file. All images shown are representative of approximately 30–40 total images captured per condition.
|