ZFIN is incorporating published figure images and captions as part of an ongoing project. Figures from some publications have not yet been curated, or are not available for display because of copyright restrictions.

PHENOTYPE:
Fish:
Observed In:
Stage: Day 5

Examples of third-order neuron labeling. Red arrowheads indicate third-order neurons labeled in the hindbrain by TRAS. Yellow dash line marks the border of mesencephalon and cerebellum. Scale bar: 50 μm.

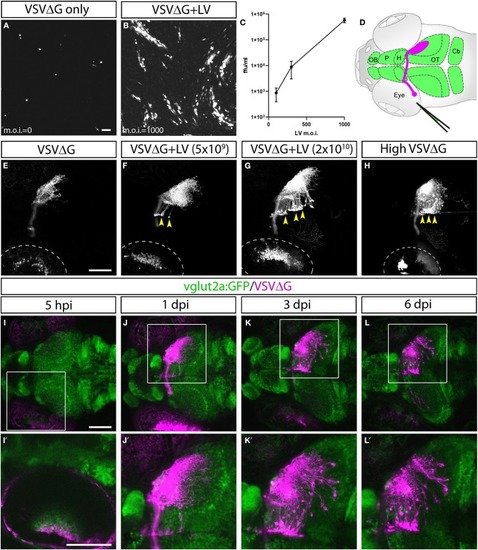
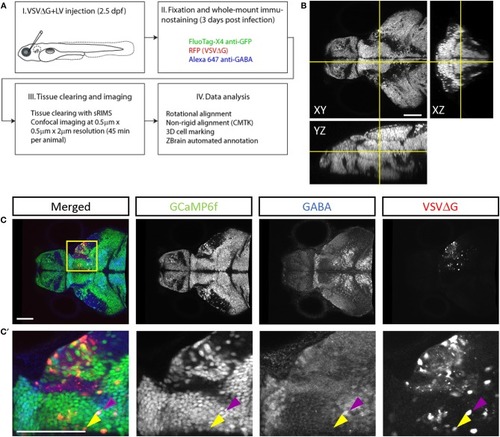
Retina injection and tissue clearing. (A)Examples of RFP expression in the retina of unpigmented (PTU-treated) animals 3 days after virus injection into the temporal retina. Images are lateral views, with rostral side to the left and dorsal side to the top. Yellow dashed lines outline the eye (outer oval) and lens (inner oval). (B,C) Tissue clearing with sRIMS solution. Whole-mount ERK1/2 immunolabeling without (B) or with sRIMS clearing (C). Orthogonal views (XY, XZ, and YZ) of confocal image stacks are shown, centered just bellowed the cerebellum (intersect of yellow lines). Ventral structures are not visible without sRIMS clearing. Scale bars are 100 μm.

TRAS labeling of GCaMP6f positive and negative cells. A single confocal imaging plane is shown, with merged, GCaMP6f, GABA, and VSVΔG channels as indicated. Boxed area in (A) is shown in higher magnification in (A'). The purple arrowheads mark two GCaMP6f+/GABA+/VSVΔG+ inhibitory neurons. The orange arrowhead marks a GCaMP6f–/GABA–/VSVΔG+ cell. Scale bars are 100 μm.

Lentivirus enabled in vitro and in vivo trans-complementation of VSVΔG and transneuronal spread. (A–C) Lentivirus trans-complementation in vitro. (A) VSVΔG was able to infect 293T cells but was unable to spread to neighboring cells, as evident by sparse single-cell infections. (B) In conjunction with lentivirus, VSVΔG was able to both infect and spread, as evident by the presence of large infected plaques. (C) The extent of VSVΔG amplification (as measured by viral titer) is positively correlated with lentivirus titer, expressed in m.o.i. (D) Illustration of viral injection and labeling of the optic nerve. Virus was microinjected into the left eye, which infected the RGC and resulted in fluorescent labeling of the RGC axons (magenta). The layout of the larval CNS is labeled in green, with the olfactory bulb (OB), pallium (P), habenula (H), optic tectum (OT), and cerebellum (Cb) labeled. (E–H)In vivo trans-complementation of VSVΔG by lentivirus. In the absence of lentivirus, VSVΔG infected RGCs and fluorescently labeled the optic nerve, but no spread in the CNS was observed (E). (F,G) When lentivirus and VSVΔG were coinjected, cellular labeling was observed in the CNS (yellow arrowheads), indicating transneuronal spread. (H) Similar patterns of spread was also seen at very high VSVΔG titer (2 × 10⁹ vs. 108 ffu/ml for E–G), suggesting that VSVΔG was able to self-complement. (I–L) Time course of VSVΔG infection and spread with lentivirus trans-complementation, with RFP expression from VSVΔG (magenta) and GFP expression from the vglut2a:GFP transgene (green). Box regions are shown at higher magnifications below (I'–L'). Scale bars are 100 μm. Images in the same row are shown at the same scale.

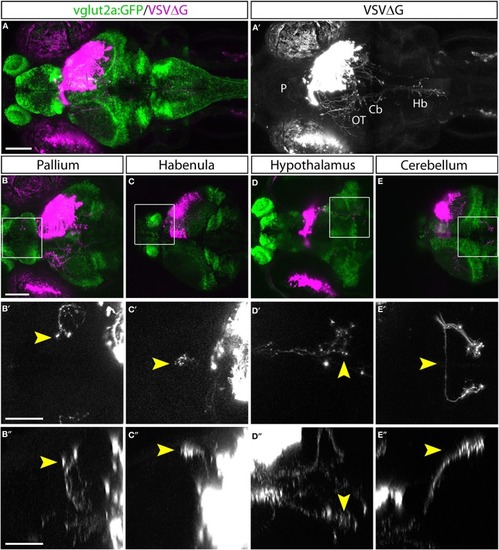
Efferent projections of retinorecipient cells. (A,A) Confocal maximal intensity projection (dorsal view) of TRAS-labeled larva, with RFP expression from VSVΔG in magenta (A) or white (A). Axon projections can be seen in the pallium (P), optic tectum (OT), cerebellum (Cb), and hindbrain (Hb). (B–E) Maximal intensity projection confocal substacks that contained the pallium (B–B), habenula (C–C), hypothalamus (D–D), and cerebellum (E–E). RFP expression from VSVΔG (magenta) and GFP expression from the vglut2a:GFP transgene (green) are shown in B–E, while boxed region is shown at higher magnification in B–E (dorsal view) and B–E (lateral view), with only the RFP channel (white). Yellow arrowheads point to the same efferent projections in the dorsal and lateral views. Scale bars are 100 μm in (A,B) and 50 μm in (B,B). Images in the same row are shown at the same scale.

Cell-type characterization of TRAS labeling. (A) The workflow for TRAS labeling, tissue processing, image acquisition, and data analysis. (B) Orthogonal views of an imaged fish after tissue clearing with sRIMS. Orthogonal views (XY, XZ, and YZ) of confocal image stacks are shown. (C,C) Cytochemical characterization of TRAS-labeled cells. A single confocal imaging plane is shown, with merged, GCaMP6f, GABA, and VSVΔG channels as indicated. Boxed area in (C) is shown in higher magnification in (C). The purple arrowhead marks a GCaMP6f+/GABA+/VSVΔG+ inhibitory neuron. The yellow arrowhead marks a GCaMP6f+/GABA–/VSVΔG+ excitatory neuron. Scale bars are 100 μm.

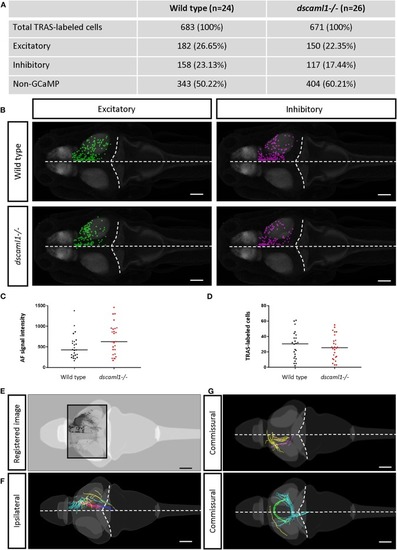
Annotation of TRAS-labeled neurons and efferent axons in the Z-Brain standard brain reference. (A) Overview of all annotated TRAS-labeled retinorecipient cells within the wild-type and dscaml1-/- cohorts. (B) Spatial layout of TRAS-labeled neurons (dorsal view, rostral to the left) overlaid onto the Z-brain reference brain scale, for wild-type (top row) and dscaml1-/- (bottom row) cohorts. Green dots mark excitatory neurons, and magenta dots mark inhibitory neurons. (C) RGC arborization field (AFs) fluorescent intensity (a proxy for starter cell number) was similar between cohorts. (D) The total number of TRAS-labeled cells per fish was not significantly different between cohorts. (E–G) Efferent tract tracing from wild-type larvae (n = 10). Maximum Z-projection is shown for confocal image (E), traced ipsilateral tracts (F), and commissural tracts (G). Axons with similar trajectories are displayed in the same color. In (B,E–G), the horizontal dashed lines indicate the midline and the curved dashed lines indicate the optic tectum/hindbrain boundary. Scale bars are 100 μm.

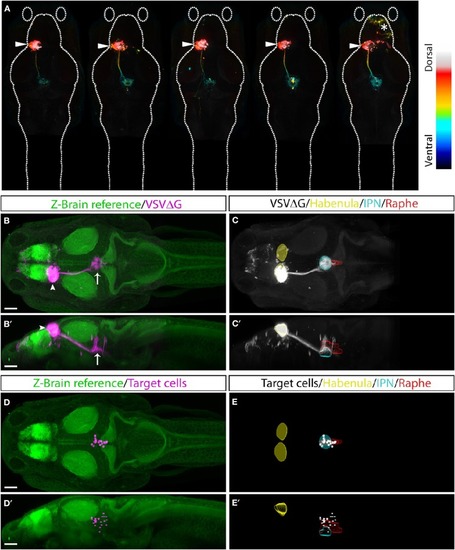
TRAS labeling of habenular target cells. (A) Five fish with TRAS tracing from the left habenula (arrowhead), viewed dorsally. The z-dimension is color-coded, as indicated in the lookup table on the right. In one fish (far right), we observed infection in the telencephalon (asterisk). Given the absence of habenula to telencephalon efferents, these cells were likely infected by virus diffusion after injection. (B–C) Combined maximal projection of registered image stacks from the animals shown in (A). The left habenula (arrowhead) projects into the IPN (arrow). RFP expression from VSVΔG infection is shown in magenta (B,B) or white (C,C'). For anatomical reference, images are overlaid on top of the Z-Brain ERK1/2 reference stack (green, B,B), or region outlines for the habenula (yellow), IPN (cyan), and raphe nucleus (red) (C,C). Dorsal (B,C) and lateral (B,C) views are shown. (D–E) Manually marked habenular target cells (magenta in D,D, white in E,E) are overlaid on top of anatomical references, as described for (A,B). Dorsal (D,E) and lateral (D,E) views are shown. Scale bars are 100 μm. All images are shown at the same scale.

Acknowledgments
This image is the copyrighted work of the attributed author or publisher, and ZFIN has permission only to display this image to its users. Additional permissions should be obtained from the applicable author or publisher of the image. Full text @ Front. Neural Circuits