IMAGE

Figure 3

ID
ZDB-IMAGE-200212-15
Source
Figures for Ma et al., 2020
Image
Figure Caption

Figure 3

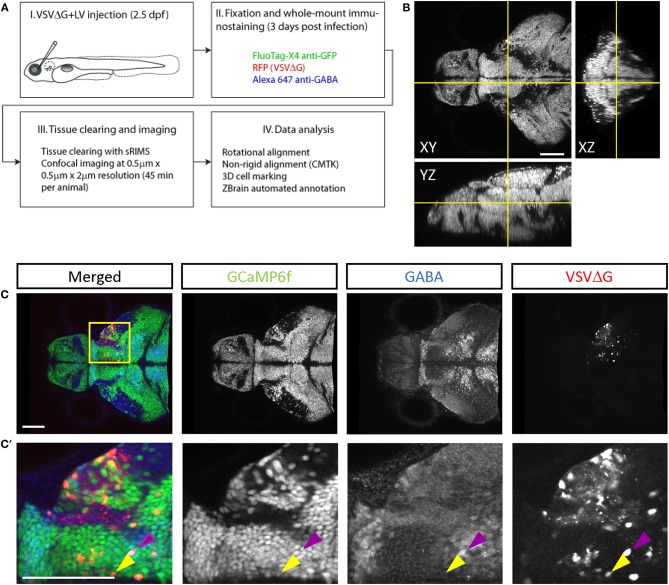
Cell-type characterization of TRAS labeling. (A) The workflow for TRAS labeling, tissue processing, image acquisition, and data analysis. (B) Orthogonal views of an imaged fish after tissue clearing with sRIMS. Orthogonal views (XY, XZ, and YZ) of confocal image stacks are shown. (C,C) Cytochemical characterization of TRAS-labeled cells. A single confocal imaging plane is shown, with merged, GCaMP6f, GABA, and VSVΔG channels as indicated. Boxed area in (C) is shown in higher magnification in (C). The purple arrowhead marks a GCaMP6f+/GABA+/VSVΔG+ inhibitory neuron. The yellow arrowhead marks a GCaMP6f+/GABA–/VSVΔG+ excitatory neuron. Scale bars are 100 μm.

Acknowledgments
This image is the copyrighted work of the attributed author or publisher, and ZFIN has permission only to display this image to its users. Additional permissions should be obtained from the applicable author or publisher of the image. Full text @ Front. Neural Circuits