IMAGE

Figure 7

ID
ZDB-IMAGE-200212-19
Source
Figures for Ma et al., 2020
Image
Figure Caption

Figure 7

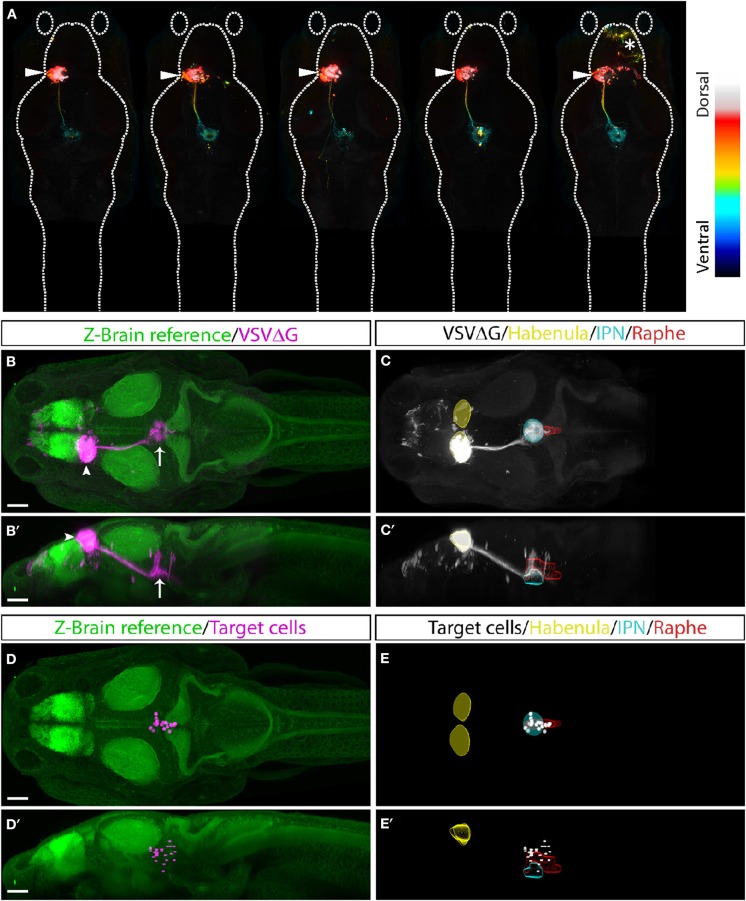
TRAS labeling of habenular target cells. (A) Five fish with TRAS tracing from the left habenula (arrowhead), viewed dorsally. The z-dimension is color-coded, as indicated in the lookup table on the right. In one fish (far right), we observed infection in the telencephalon (asterisk). Given the absence of habenula to telencephalon efferents, these cells were likely infected by virus diffusion after injection. (B–C) Combined maximal projection of registered image stacks from the animals shown in (A). The left habenula (arrowhead) projects into the IPN (arrow). RFP expression from VSVΔG infection is shown in magenta (B,B) or white (C,C'). For anatomical reference, images are overlaid on top of the Z-Brain ERK1/2 reference stack (green, B,B), or region outlines for the habenula (yellow), IPN (cyan), and raphe nucleus (red) (C,C). Dorsal (B,C) and lateral (B,C) views are shown. (D–E) Manually marked habenular target cells (magenta in D,D, white in E,E) are overlaid on top of anatomical references, as described for (A,B). Dorsal (D,E) and lateral (D,E) views are shown. Scale bars are 100 μm. All images are shown at the same scale.

Acknowledgments
This image is the copyrighted work of the attributed author or publisher, and ZFIN has permission only to display this image to its users. Additional permissions should be obtained from the applicable author or publisher of the image. Full text @ Front. Neural Circuits