FIGURE

Figure 2

ID
ZDB-FIG-200212-11
Publication
Ma et al., 2020 - Structural Neural Connectivity Analysis in Zebrafish With Restricted Anterograde Transneuronal Viral Labeling and Quantitative Brain Mapping
Other Figures
All Figure Page
Back to All Figure Page
Figure 2

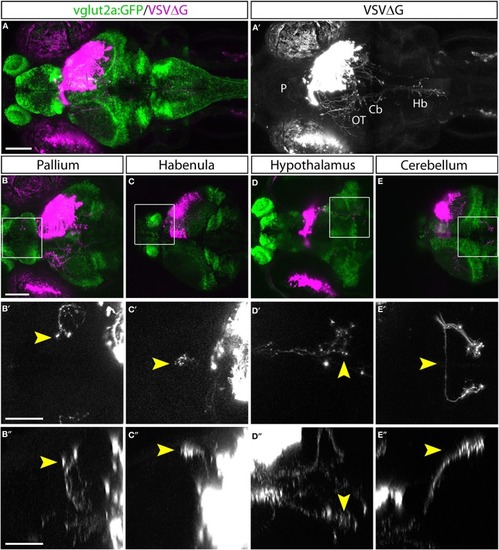
Efferent projections of retinorecipient cells. (A,A) Confocal maximal intensity projection (dorsal view) of TRAS-labeled larva, with RFP expression from VSVΔG in magenta (A) or white (A). Axon projections can be seen in the pallium (P), optic tectum (OT), cerebellum (Cb), and hindbrain (Hb). (B–E) Maximal intensity projection confocal substacks that contained the pallium (B–B), habenula (C–C), hypothalamus (D–D), and cerebellum (E–E). RFP expression from VSVΔG (magenta) and GFP expression from the vglut2a:GFP transgene (green) are shown in B–E, while boxed region is shown at higher magnification in B–E (dorsal view) and B–E (lateral view), with only the RFP channel (white). Yellow arrowheads point to the same efferent projections in the dorsal and lateral views. Scale bars are 100 μm in (A,B) and 50 μm in (B,B). Images in the same row are shown at the same scale.

Expression Data

Expression Detail
Antibody Labeling
Phenotype Data

Phenotype Detail
Acknowledgments
This image is the copyrighted work of the attributed author or publisher, and ZFIN has permission only to display this image to its users. Additional permissions should be obtained from the applicable author or publisher of the image. Full text @ Front. Neural Circuits