

TGFβ1 increased MDA‐MB‐231 cell invasion and affected cancer cell morphology change. A, MDA‐MB‐231 cells were treated with TGFβ1 (0, 2.5, 5, 10, 20 ng/mL) for 48 h, the cell morphology was analyzed by microscopy. The morphology of the cancer cells changed to an elongated spindle shape (original magnification, ×400). B, MDA‐MB‐231 cells were treated with TGFβ1 (0, 1.25, 2.5, 5, 10, 20 ng/mL) for 24 h in transwell, the invasion cells were stained with 0.1% crystal violet. Invasion cell number was significantly increased at 5, 10, 20 ng/mL TGFβ1‐treated cells compared to control (original magnification, ×100). ** |

TGFβ1 stimulated MDA‐MB‐231 cell endogenous TGFβ1 and Vimentin expression and inhibited E‐cadherin expression. MDA‐MB‐231 cells were treated with TGFβ1 (0, 1.25, 2.5, 5, 10, 20 ng/mL) for 48 hours. TGFβ1, E‐cadherin, and Vimentin protein level was analyzed by immunofluorescence staining (A) and Western blotting (B). β‐actin was as an inner control. Immunofluorescence staining was observed with the laser confocal scanning microscope (original magnification, ×600). ** |
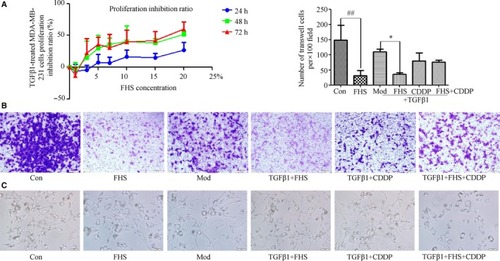
FHS affected both MDA‐MB‐231 cells and TGFβ1‐treated cell morphological change, proliferation, and invasion. A, After FHS treated TGFβ1‐induced MDA‐MB‐231 cells for 24, 48, 72 h, 3‐(4,5‐Dimethylthiazol‐2‐yl)‐2,5‐diphenyltetrazolium bromide assay showed that FHS inhibited TGFβ1‐induced MDA‐MB‐231 cell proliferation. B, Invasive assay after FHS treated 24 h (original magnification, ×100). C, Cell morphological changes of MDA‐MB‐231 cells and TGFβ1‐treated MDA‐MB‐231 cells in different treatment groups (original magnification, ×200). Con group represents the 20% blank‐control serum group, FHS group represents the 20% Fangjihuangqi Decoction‐medicated serum (FHS), Mod group represents TGFβ1 (10 ng/mL) plus 20% blank‐control serum group, FHS + TGFβ1 group represents 20% FHS plus TGFβ1 (10ng/ml), CDDP + TGFβ1 group represents cisplatin (10 μmol/L) plus TGFβ1 (10 ng/mL) and 20% blank‐control serum group, which was as the positive control, and FHS + CDDP + TGFβ1 group represents 20% FHS plus cisplatin (10μmol/L) and TGFβ1 (10ng/ml). * |
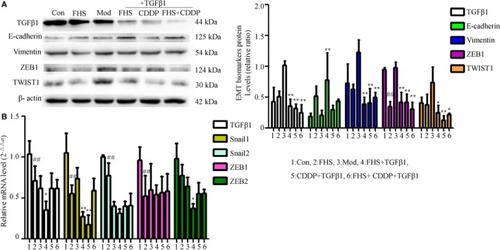
FHS regulated EMT marker expression in MDA‐MB‐231 cells and TGFβ1‐treated cells. The protein expression of TGFβ1, E‐cadherin, Vimentin, ZEB1, and TWIST1 was determined by Western blotting (A). β‐actin was as an inner control. Target protein expression was normalized against β‐actin protein expression. The mRNA expression of TGFβ1, Snail1, Snail2, ZEB1, and ZEB2 was determined by RT‐qPCR (B). The mRNA level of β‐actin was used as an inner control, and gene‐specific mRNA expression was normalized against β‐actin expression. Control group represents the 20% blank‐control serum group, FHS group represents the 20% Fangjihuangqi Decoction‐medicated serum (FHS), Mod group represents TGFβ1 (10 ng/mL) plus 20% blank‐control serum group, FHS + TGFβ1 group represents 20% FHS plus TGFβ1 (10ng/ml), CDDP + TGFβ1 group represents cisplatin (10 μmol/L) plus TGFβ1 (10 ng/mL) and 20% blank‐control serum group, which was as the positive control, and FHS + CDDP + TGFβ1 group represents 20% FHS plus cisplatin (10 μmol/L) and TGFβ1 (10 ng/mL). ** |

FH inhibited tumor growth in TNBC xenograft zebrafish model. 200 TGFβ1 48 h treated TNBC cells labeled with a red fluorescent dye (CM‐DiI) were injected into 2dpf normal zebrafish yolk sac. After xenograft tumor model was established, the tumor models were treated with FH‐L, FH‐M, FH‐H, CDDP, and control. The fluorescence images were analyzed by a laser confocal scanning microscope. The representative pictures were observed with the laser confocal scanning microscope (original magnification, × 80). The fluorescence IOD was used to evaluate the tumor growth inhibition ratio of Fangjihuangqi Decoction on TNBC xenograft tumor in zebrafish. Image Pro Plus was used to analysis the relative IOD value. Normal represents normal wild‐type AB strain zebrafish, Mod represents the TNBC xenograft tumor model in zebrafish, CDDP represents cisplatin (15 μg/mL), FH‐L represents Fangjihuangqi Decoction (55.5 μg/mL), FH‐M represents Fangjihuangqi Decoction (111 μg/mL), FH‐H represents Fangjihuangqi Decoction (222 μg/mL). ** |
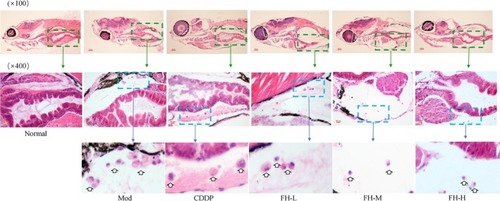
FH inhibited the formation of the histopathological structure of TNBC xenograft zebrafish tumor models. After xenograft tumor model was established, the tumor models were treated with FH‐L, FH‐M, FH‐H, CDDP, and control. The histology was analyzed by microscopy. The green arrow indicates that the tumor cell area observed under ×10 objective lens; the blue arrow indicates that the tumor cell area observed under ×40 objective lens. White hollow arrow indicates the tumor cell. Normal represents normal wild‐type AB strain zebrafish, Mod represents the TNBC xenograft tumor model in zebrafish, CDDP represents cisplatin (15 μg/mL), FH‐L represents Fangjihuangqi Decoction (55.5 μg/mL), FH‐M represents Fangjihuangqi Decoction (111 μg/mL), and FH‐H represents Fangjihuangqi Decoction (222 μg/mL) |

FH decreased tumor angiogenesis in TNBC xenograft zebrafish. 200 TGFβ1 48 h treated TNBC cells labeled with a red fluorescent dye (CM‐DiI) were injected into 2dpf normal transgenic vascular green fluorescent zebrafish yolk sac. After xenograft tumor model was established, the tumor models were treated with FH‐L, FH‐M, FH‐H, CDDP, and control. The fluorescence images were analyzed by a laser confocal scanning microscope. The representative pictures of subintestinal vessel sprout were observed with the laser confocal scanning microscope (original magnification, 200×). White solid arrow indicates sprouts of subintestinal blood vessels. The red is the MDA‐MB‐231 cells of TGFβ1‐treated and labeled with CM‐DiI. The number of buds in the intestine was used to evaluate the inhibition of FH on neovascularization. Normal represents normal transgenic vascular green fluorescent zebrafish, Mod represents the TNBC xenograft tumor model in zebrafish, thalidomide represents thalidomide (219 μg/mL), FH‐L represents Fangjihuangqi Decoction (55.5 μg/mL), FH‐M represents Fangjihuangqi Decoction (111 μg/mL), and FH‐H represents Fangjihuangqi Decoction (222 μg/mL). ** |
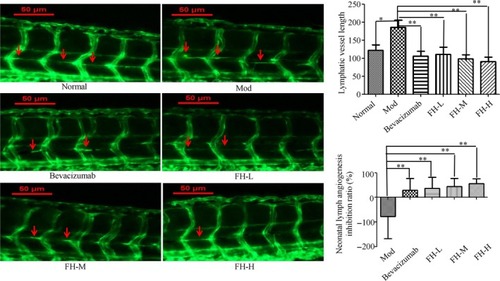
FH affected tumor lymphangiogenesis in TNBC xenograft tumor zebrafish. 200 TGFβ1 48 h treated TNBC cells labeled with a red fluorescent dye (CM‐DiI) were injected into 2dpf normal transgenic vascular green fluorescent zebrafish yolk sac. After xenograft tumor model was established, the tumor models were treated with FH‐L, FH‐M, FH‐H, CDDP, and control. The rhodamine‐labeled dextran (TRITC‐Dextran) intravenously was injected into the zebrafish tumor models for angiography. The lymphatic vessels were observed under a laser confocal microscope (original magnification, 160×). Red arrow indicates lymphatics. The length of lymphatic vessels above the zebrafish cloaca was used to evaluate the inhibition ratio of FH on lymphatic vessels. Normal represents normal transgenic vascular green fluorescent zebrafish, Mod represents the TNBC xenograft tumor model in zebrafish, bevacizumab represents bevacizumab (250 ng/tail), FH‐L represents Fangjihuangqi Decoction (55.5 μg/mL), FH‐M represents Fangjihuangqi Decoction (111 μg/mL), and FH‐H represents Fangjihuangqi Decoction (222 μg/mL). ** |

FH moderated EMT marker expression in TNBC xenograft tumor zebrafish. 200 TGFβ1 48 h treated TNBC cells labeled with a red fluorescent dye (CM‐DiI) were injected into 2dpf normal zebrafish yolk sac. After xenograft tumor model was established, the tumor models were treated with FH‐L, FH‐M, FH‐H, CDDP, and control. The protein level of TGFβ1, E‐cadherin, Snail2, ZEB2, and TWIST1 was determined by Western blotting (A). β‐actin was as an inner control. Target protein expression was normalized against β‐actin protein expression. The mRNA expression of TGFβ1, Snail2, ZEB2, and TWIST1 was determined by RT‐qPCR, the mRNA level of β‐actin was used as an inner control, and gene‐specific mRNA expression was normalized against β‐actin expression (B). Normal represents normal wild‐type AB strain zebrafish, Mod represents the TNBC xenograft tumor model in zebrafish, CDDP represents cisplatin (15 μg/mL), FH‐L represents Fangjihuangqi Decoction (55.5 μg/mL), FH‐M represents Fangjihuangqi Decoction (111 μg/mL), and FH‐H represents Fangjihuangqi Decoction (222 μg/mL). ** |
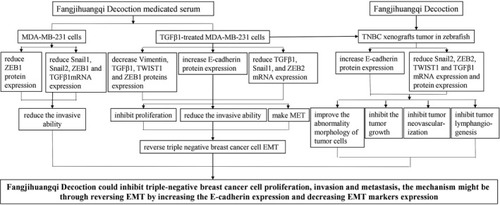
The underlying mechanism chart of Fangjihuangqi Decoction treatment on TNBC. Administration of Fangjihuangqi Decoction prevented the development of TNBC metastasis through reversing EMT by increasing the E‐cadherin expression and decreasing EMT marker expression by in vitro experiment and zebrafish xenograft tumor model |