
|
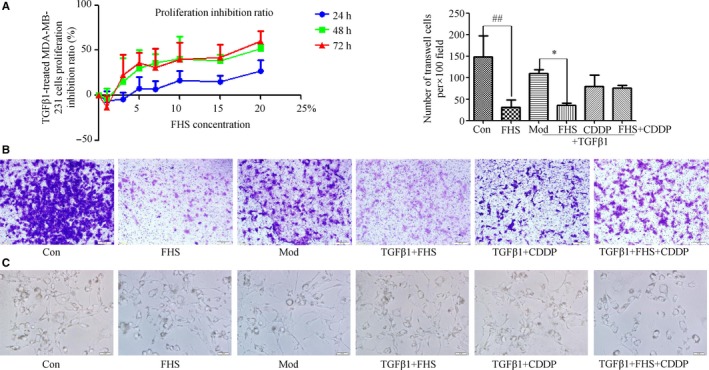
Figure 3
FHS affected both MDA‐MB‐231 cells and TGFβ1‐treated cell morphological change, proliferation, and invasion. A, After FHS treated TGFβ1‐induced MDA‐MB‐231 cells for 24, 48, 72 h, 3‐(4,5‐Dimethylthiazol‐2‐yl)‐2,5‐diphenyltetrazolium bromide assay showed that FHS inhibited TGFβ1‐induced MDA‐MB‐231 cell proliferation. B, Invasive assay after FHS treated 24 h (original magnification, ×100). C, Cell morphological changes of MDA‐MB‐231 cells and TGFβ1‐treated MDA‐MB‐231 cells in different treatment groups (original magnification, ×200). Con group represents the 20% blank‐control serum group, FHS group represents the 20% Fangjihuangqi Decoction‐medicated serum (FHS), Mod group represents TGFβ1 (10 ng/mL) plus 20% blank‐control serum group, FHS + TGFβ1 group represents 20% FHS plus TGFβ1 (10ng/ml), CDDP + TGFβ1 group represents cisplatin (10 μmol/L) plus TGFβ1 (10 ng/mL) and 20% blank‐control serum group, which was as the positive control, and FHS + CDDP + TGFβ1 group represents 20% FHS plus cisplatin (10μmol/L) and TGFβ1 (10ng/ml). *