- Title
-
Disruption of dmrt1 rescues the all-male phenotype of cyp19a1a mutant in zebrafish - A Novel insight into the roles of aromatase/estrogens in gonadal differentiation and early folliculogenesis
- Authors
- Wu, K., Song, W., Zhang, Z., Ge, W.
- Source
- Full text @ Development

ZFIN is incorporating published figure images and captions as part of an ongoing project. Figures from some publications have not yet been curated, or are not available for display because of copyright restrictions. EXPRESSION / LABELING:
PHENOTYPE:
|
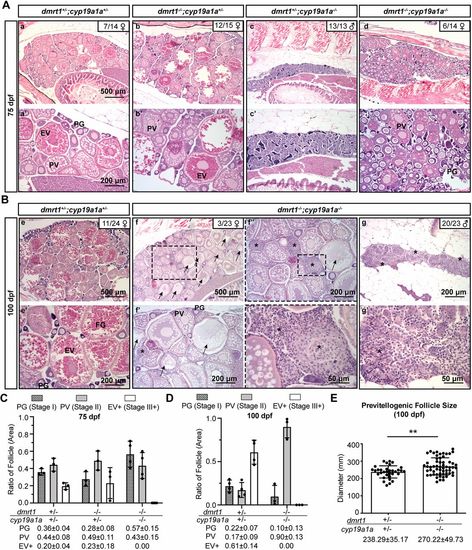
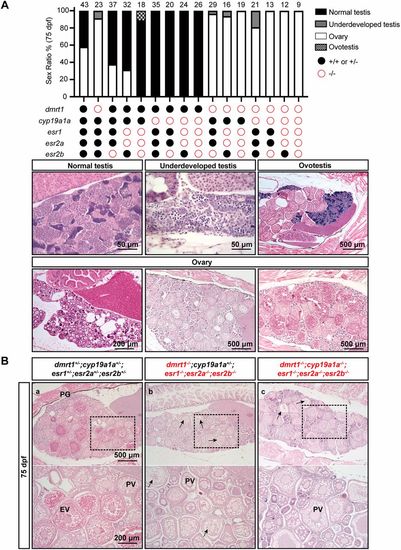
Phenotype analysis of female zebrafish in different genotypes. (A,B) Histological examination of gonads in different genotypes of dmrt1;cyp19a1a at 75 dpf (A) and 100 dpf (B). PG, primary growth; PV, pre-vitellogenic; EV, early vitellogenic; FG, full grown. Arrows indicate atresic/degenerating follicles. Asterisks indicate stromal cells. (C,D) Ratios of PG, PV and vitellogenic (EV+) follicle areas in different genotypes at 75 dpf (C) and 100 dpf (D). Data are mean±s.d. The exact values are shown under the x-axis. (E) The size of PV follicles in controls and double mutants (dmrt1−/−;cyp19a1a−/−) at 100 dpf. Each dot represents the average diameter of PV follicles with visible germinal vesicles from each fish (quantified from three different sections). Data are mean±s.d. and the exact values are shown under the x-axis. Statistical significance was revealed by two-tailed unpaired Student's t-test (**P<0.01). PHENOTYPE:
|
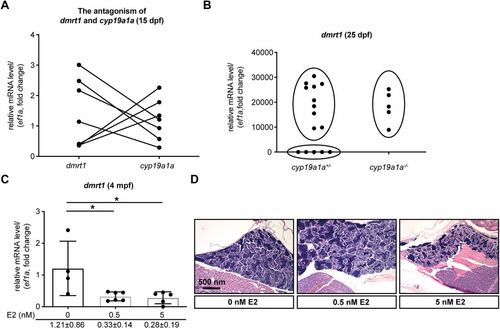
Estrogen suppression of dmrt1 expression. (A) The reciprocal expression of dmrt1 and cyp19a1a in wild-type individuals at 15 dpf (n=7). (B) Expression of dmrt1 in cyp19a1a+/− (n=15) and cyp19a1a−/− (n=5) zebrafish at 25 dpf. Individual data points are shown. (C) Response of dmrt1 expression to E2 treatment (0 nM, 1.21±0.86, n=4; 0.5 nM, 0.33±0.14, n=6; 5 nM, 0.28±0.19, n=6) at 4 mpf. The data points are expressed as mean±s.d. and the exact values are shown under the x-axis. Statistical significance was revealed by one-way ANOVA and Tukey's test (*P<0.05). (D) Histology of representative fish exposed to different concentrations of E2 (0 nM, 0.5 nM and 5 nM). EXPRESSION / LABELING:
|