
|
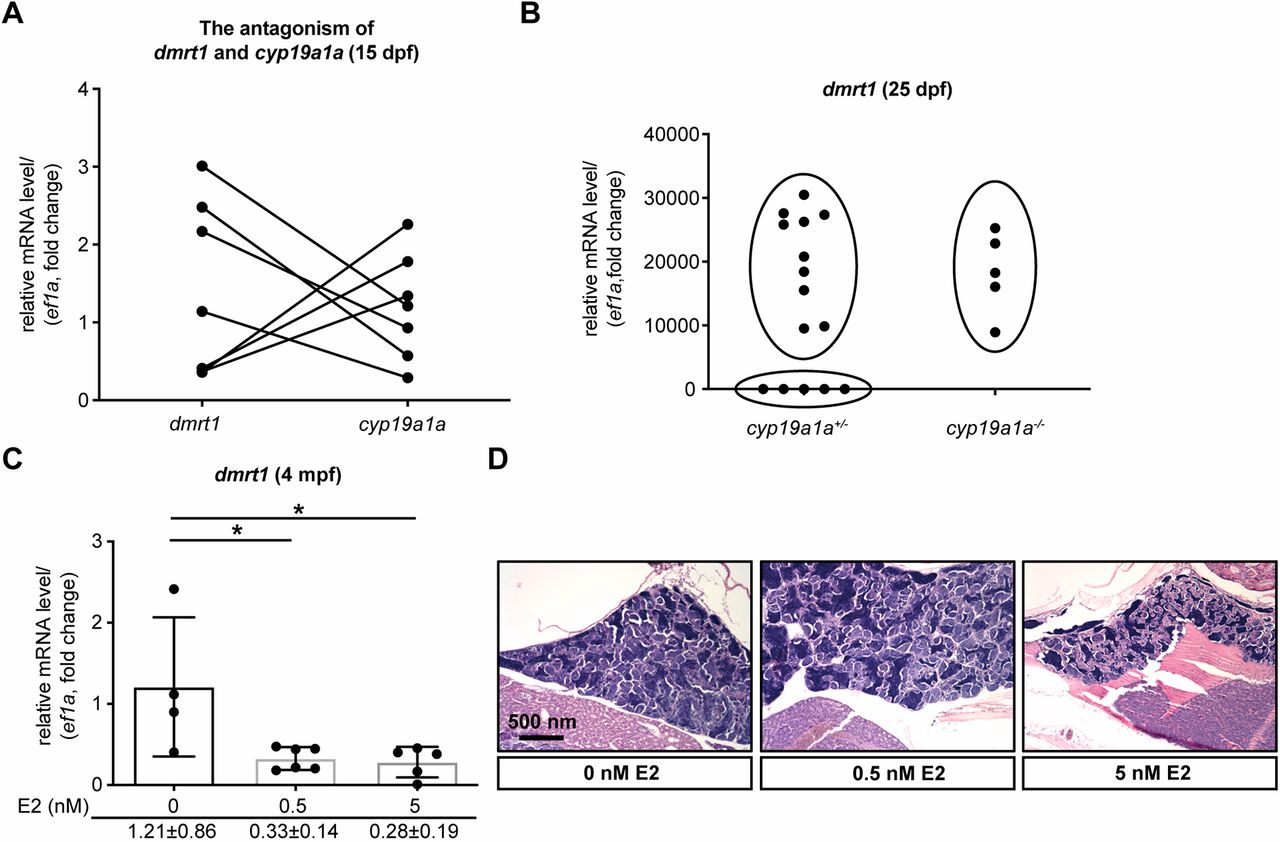
Fig. 3 Estrogen suppression of dmrt1 expression. (A) The reciprocal expression of dmrt1 and cyp19a1a in wild-type individuals at 15 dpf (n=7). (B) Expression of dmrt1 in cyp19a1a+/− (n=15) and cyp19a1a−/− (n=5) zebrafish at 25 dpf. Individual data points are shown. (C) Response of dmrt1 expression to E2 treatment (0 nM, 1.21±0.86, n=4; 0.5 nM, 0.33±0.14, n=6; 5 nM, 0.28±0.19, n=6) at 4 mpf. The data points are expressed as mean±s.d. and the exact values are shown under the x-axis. Statistical significance was revealed by one-way ANOVA and Tukey's test (*P<0.05). (D) Histology of representative fish exposed to different concentrations of E2 (0 nM, 0.5 nM and 5 nM).