FIGURE SUMMARY
Title

AXL and CAV-1 play a role for MTH1 inhibitor TH1579 sensitivity in cutaneous malignant melanoma

Authors
Das, I., Gad, H., Bräutigam, L., Pudelko, L., Tuominen, R., Höiom, V., Almlöf, I., Rajagopal, V., Hansson, J., Helleday, T., Egyházi Brage, S., Warpman Berglund, U.
Source
Full text @ Cell Death Differ.

CMM cells are sensitive to MTH1 inhibitor TH1579 independent of <italic>BRAF/NRAS</italic> mutational status.

a High MTH1 mRNA expression significantly decreases overall survival in CMM patients (n = 460) (data analyzed from TCGA). b Cell viability measured by MTS following 72 h treatment with TH1579 shows that NRAS, BRAF mutated and WT CMM are sensitive to TH1579 treatment. CMM cells with acquired or intrinsic resistance to vemurafenib have higher IC50 values for TH1579. (Error bars represent mean ± SEM; n = 3). c Representative images taken before (day 0) and after 72 h (day 3) of treatment showing the effects of 2 µM TH1579 on CMM spheroid compared with control (DMSO) treated spheroids. d After 72 h treatment with 0, 0.5, 1, 2 or 4 µM TH1579, the cell viability of the spheroids were measured by CellTiterGlo. (Error bars represent mean ± SD; n = 3, ***p < 0.001, two-way ANNOVA test). e Short-term patient-derived cell line, 159-Pre (BRAF WT) was cultured as spheroids and treated with TH1579 at concentrations shown in the figure. After 72 h treatment, cell viability was measured by CellTiterGlo. (Error bars represent mean ± SD; n = 3, ***p < 0.001, two-way ANNOVA test). f Schematic illustration of the experimental model of CMM  transplanted zebrafish embryo disease model used in this study. Briefly, ~100 CMM cells stably expressing tdTomato and luciferase were injected into blastula of zebrafish embryo. The next day, embryos were screened for successful transplantation, and distributed into six-well plates (15 embryos/well). TH1579 was added directly to the medium to a final concentration of 20 or 40 μM. After 72 h, individual embryos were lysed and amount of CMM cells (i.e., tumor volume) were measured by luminescence. g TH1579 (20 μM) significantly reduces tumor volume in CMM transplanted zebrafish embryo disease model. Tumor size calculated as % of reduction of DMSO control. Data shown as mean ± SD from n = 4 independent experiments (Error bars represent mean ± SD, **p < 0.01, ***p < 0.001, ****p < 0.0001, Student’s t test). h Loss of Ki67 signal shown by IF of zebrafish embryo sections transplanted with SkMel2 collected after 72 h treatment with TH1579 (20 µM).

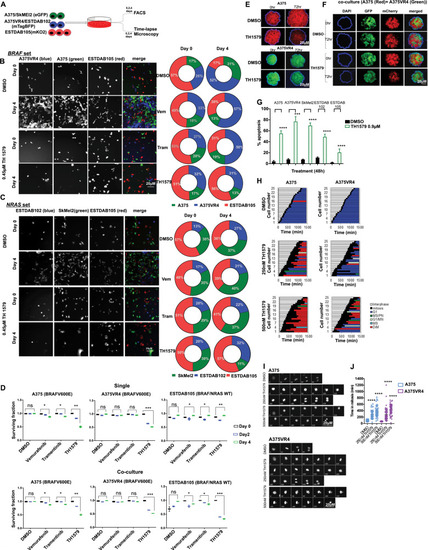
TH1579 treatment causes prolonged time in mitosis and cell death in co-culture (NRAS and BRAF sets) as well as in 3D spheroid culture of CMM cells.

a Schematic illustration of single and co-culture experiments to compare drug sensitivity. Briefly, A375 and SkMEl2 cells were tagged with eGFP (green), A375VR4 and ESTDAB102 with mTagBFP (blue) and ESTDAB105 with mKO2 (red). Cells were then either single cultured or co-cultured as BRAF set (A375, A375VR4, and ESTDAB105) or NRAS set (SkMel2, ESTDAB102, and ESTDAB105) overnight before treatment with DMSO or BRAF inhibitor (Vemurafenib, Vem, 0.4 μM), MEK inhibitor (Trametinib, Tram, 3 nM), or MTH1 inhibitor (TH1579, 0.45 μM) for 4 days. Time-lapse microscopy was performed to detect changes in cell proliferation by measuring number of cells (DAPI count) followed by quantification using cell profiler software. The proportion of each CMM cell line (shown in b and c) was calculated as % of total number of cells day 0 (i.e., before treatment) and day 4 (i.e., following 4 days treatment), respectively. FACS was performed on day 0, 2, and 4 to measure fraction of apoptotic cells (measured as a ratio of number of labeled + AnnV + cells to total number of labeled + cells). b For the BRAF set, the BRAFi resistant A375VR4 cell approximately doubled its proportion after 4 days in control (DMSO), vemurafenib as well as trametinib treated cells. TH1579 treated co-culture showed almost no change in cell proportions day 4 compared with day 0. c For the NRAF set, TH1579 was particularly effective in stopping proliferation of SkMel2, since the proportion of SkMel2 went from 30% day 0 to 11% day 4, as compared with the proportion of control treated co-culture from 30% day 0 to 38% day 4. d FACS analysis shows that BRAF mutant and NRAS mutant CMM cells retain their sensitivity towards TH1579 either when cultured separately or in a co-culture system (error bars represent mean ± SD; n = 3, *p < 0.05, **p < 0.01, ***p < 0.001, ****p < 0.000, Student’s t test). Data shown as ratio of number of Annexin V labeled cells to total number of labeled cells for each cell line (i.e., fraction of survival cells) either co-cultured or as cultured separately, before treatment (day 0), and treatment day 2 and 4. e Representative images of A375 and A375VR4 spheroids treated with DMSO (control) or TH1579 (2 µM) for 72 h (n = 3). f Representative images of spheroid co-culturing of A375 with its vemurafenib resistant subline A375VR4 before and following DMSO (control) or TH1579 (2 µM) for 72 h (n = 3). g Treatment with TH1579 triggers cell death via induction of apoptosis. CMM cells were treated for 48 h with 0.9 µM TH1579 and analyzed by Annexin V + stain and PI + stain (FACS) (error bars represent mean ± SD; n = 3, *p < 0.05, **p < 0.01, ***p < 0.001, ****p < 0.000, Student’s t test). h Histone labeling followed by time-lapse microscopy analysis shows that A375 and A375VR4 CMM cells treated with lower doses of TH1579 (250 nM and 500 nM) display a significantly prolonged mitotic phase (M) followed by mitotic slippage and polynucleation (MS/PN), micronuclei (G1/MN), mitotic slippage (MS) and death in mitosis (DiM). i Representative Images from time-lapse experiment in h. j Quantification of of the time in mitosis in h. (error bars represent mean ± SD; n = 2, *p < 0.05, **p < 0.01, ***p < 0.001, ****p < 0.0001, Student’s t test).

TH1579 induces ROS leading to increased DNA damage in CMM cells.

a FACS plot showing differences in baseline ROS levels across CMM cells as measured by H2DCFA counts. b Quantification of a (error bars represent mean ± SD; n = 3). c CMM cells treated for 3 h with TH1579 (0.9 µM) displays elevated ROS levels using H2DCFA assay (error bars represent mean ± SD; n = 3; *p < 0.05, **p < 0.01, ***p < 0.001, ns: not significant, Student's t test). d TH1579 induced ROS (data shown in c) is positively correlated with percentage of apoptosis (data obtain in Fig. 2g) after drug treatment. e Representative image from western blot showing baseline MTH1 expression levels in CMM cells. f A positive trend, however not significant, is found between baseline MTH1 expression (data obtained from e) and ROS levels (data obtained from b) in CMM cells. g Representative image of western blot showing that 24 h treatment with 0.9 µM TH1579 (n = 3) increases p-H2AX signal (DNA damage marker) and cleaved caspase 3 (apoptosis marker) in CMM cells. h Representative images of modified comet assay in CMM cells (A375, A375VR4, and ESTDAB102) treated with TH1579 (0.9 µM) and SkMel2 treated with 0.6 µM TH1579. Comets are treated without (control) and with OGG1 to identify 8-oxodG. i Quantification of h (error bars represent mean ± SD; n = 3; *p < 0.05, **p < 0.01, ***p < 0.001, Student’s t test).

Knockdown of MTH1 in CMM cells, excluding BRAF inhibitor resistant subline A375VR4, sensitizes cells towards cell death.

a A representative image from western blot of MTH1 knockdown in CMM cell lines. Two different shRNAs were used (sh2 and sh3) and compared with control (NT). Knockdown of MTH1 induces cleaved caspase 3 in all cell lines tested except A375VR4 (n = 2 independent experiments). b shMTH1 induces apoptosis measured by FACS (Annexin V) in A375, SkMel2, and ESTDAB105, but not in A375VR4 CMM cells. (error bars represent mean ± SD; n = 3; *p < 0.05, **p < 0.01, ***p < 0.001, Student's t test). c Representative images from clonogenic survival following shRNA MTH1 knockdown (sh2 and sh3) or control (NT) in CMM cell lines. d Quantification of c by measuring absorbance at 540 nm as a readout. (error bars represent mean ± SD; n = 3; *p < 0.05, **p < 0.01, ***p < 0.001, Student's t test). e Knockdown of MTH1 (sh2, sh3) in A375VR4 cells followed by western blot shows that the knockdown can cause induction of DNA damage (p21 and p-H2AX S139) for both shRNA sequences tested when compared with the nontargeting control shRNA. (western blot is a representative image of n = 2). f ROS levels measured by H2DCFA assay following MTH1 knockdown (sh2) or control (NT) in A375 cells and A375VR4. (error bars represent mean ± SD; n = 3; *p < 0.05, **p < 0.01, ***p < 0.001, Student's t test). g Representative images from time-lapse microscopy following doxycycline-induced knockdown (shMTH1 dox) of MTH1 or control (shNT dox and shMTH1 no dox) in A375VR4 cells. h, i Quantification of g. MTH1 knockdown (doxycycline-induced shRNA) in A375VR4 cells show no change of time in mitosis (error bars represent mean ± SD; n = 2, *p < 0.05, **p < 0.01, ***p < 0.001, ****p < 0.0001). j Representative images from time-lapse microscopy following doxycycline-induced knockdown (shMTH1 dox) of MTH1 or control (shNT dox and shMTH1 no dox) in A375 cells. k, l Quantification of j. MTH1 knockdown (doxycycline-induced shRNA) in A375 cells induce significantly prolonged time in mitosis (p < 0.01) (error bars represent mean ± SD; n = 2; ***p < 0.001, Student's t test).

AXL and CAV-1 mediate sensitivity of CMM cells towards TH1579.

a Representative image of western blot without (−) and with (+) 24 h treatment of 0.9 µM TH1579 in CMM cells. b Short-term (1, 3, and 6 h) treatment with TH1579 (0.3 and 0.9 µM) downregulates AXL in AXL overexpressing CMM cells as seen in representative image of western blot. c Cells with higher AXL mRNA expression have tendency to be more sensitive to TH1579. Data are obtained from Figs. 2g and 5a and plotted as correlation between AXL expression (normalized to loading control) and % apoptosis (Annexin V staining, FACS). d AXL overexpression was done in CMM cells with endogenous low AXL. The image is a representative western blot from n = 2 independent experiments. e Overexpression of AXL triggers sensitivity towards TH1579. Overexpression was done in CMM cells with low AXL (A375, ESTDAB105) for 24 h followed by 24 h treatment with 0.9 µM TH1579 and apoptosis measured by using FACS staining for Annexin V+, PI+. (error bars represent mean ± SD; n = 3; *p < 0.05, **p < 0.01, ***p < 0.001, Student's t test). f ROS measurement by H2DCFDA assay confirms that ROS is induced in both cell lines upon AXL overexpression (O.E) compared with control cells. (error bars represent mean ± SD; n = 3; *p < 0.05, **p < 0.01, ***p < 0.001, Student's t test). g Ratio of AXL and MTH1 expression correlate positively, although not significant (r = 0.64, p = 0.2) in CMM patients on comparing matched pretreatment samples to those taken during treatment (immunotherapy or targeted therapy) (n = 5). h Representative western blot image of n = 2 independent experiments. CAV-1 which is highly expressed in A375VR4 is downregulated after 24 h treatment with 0.9 µM TH1579 compared with control treated cells. Also MET and JNK1 (MAPK8) are downregulated compared with control cells. i Knockdown of CAV-1 (siRNA#1 and #4) decreases TH1579 sensitivity as analyzed by Annexin V staining using FACS in A375VR4 CMM cells (error bars represent mean ± SD; n = 3; *p < 0.05, **p < 0.01, ***p < 0.001, Student's t test). j shMTH1 (sh2 and sh3) does not reduce CAV-1 expression in A375VR4. Contrary to the inhibitor, knockdown of MTH1 alone does not decrease CAV-1 expression levels as seen by western blot (Data shown as a representative western blot image, n = 2). k Proximity Ligation Assay (PLA) shows CAV-1 and MTH1 interact in A375VR4. Analysis by PLA indicates that MTH1 and CAV-1 interacts only in A375VR4 and not in A375 or SKMel2. Data shown as a representative image, n = 2. l Quantification of (K) (error bars represent mean ± SD; n = 2; *p < 0.05, **p < 0.01, ***p < 0.001, Student's t test). m Treatment with TH1579 (20 µM) decreases expression of CAV-1 in an A375VR4 zebrafish disease model as seen by IF. n CAV-1 expression correlates to MTH1 expression in CMM patients both in responders to targeted and immunotherapy (n = 25). Sample set previously used in [44] (*p < 0.05, Student's t test).

Combination treatment of TH1579 with vemurafenib (PLX4032) further sensitizes BRAF mutant CMM cells both in vitro and in vivo.

a 72 h treatment of BRAF mutant cells A375 and A375VR4 with the combination TH1579 (0.2 µM) and vemurafenib (0.1 µM) leads to further loss of cell viability as measured by an MTS assay when compared with either drug alone (error bars represent mean ± SD; n = 3; *p < 0.05, Student's t test). b The loss of cell viability observed in a translates into apoptosis mediated cell death which is further enhanced by the drug combination (treatment done for 48 h) as analyzed by FACS and Annexin V staining (error bars represent mean ± SD; n = 3; *p < 0.05, Student’s t test). c Combining vemurafenib with TH1579 significantly induces ROS levels (treatment done for 3 h) when compared with either drug alone (error bars represent mean ± SD; n = 3; *p < 0.05, Student's t test). d Representative images taken by microscopy to show A375 (stably expressing dTomato) and A375VR4 (stably expressing eGFP) tumors in zebrafish disease model after 72 h drug exposure with DMSO, vemurafenib (20 µM), TH1579 (20 µM) or the combination. e Individual tumor sizes from zebrafish embryos were analyzed after lysing zebrafish and measure luminescence. Data presented as % tumor size compared with the median tumor size calculated for that group (error bars represent mean ± SD; n = 3; *p < 0.05, **p < 0.01, ***p < 0.001, ****p < 0.0001, Student's t test). f, g CAV-1, AXL, and AKT are most efficiently downregulated by combination treatment following 48 h treatment. Representative western blot image (f) and densiometric quantification of the western blot (g) (data shown as mean ± SD, n = 2).

Schematic illustration how TH1579 downregulates AXL and CAV-1 expression and induces ROS, leading to DNA damage and cell death.

a In BRAF mutant CMM, TH1579 treatment inhibits MTH1, elevates ROS, causes a mitotic arrest, DNA damage and reduced AKT signaling. Combining BRAF inhibitor vemurafenib and TH1579 results in additive/synergistic responses by affecting several pathways leading to apoptosis and cell death. b BRAF inhibitor resistant CMM have upregulated levels of AXL and CAV-1, resulting in overactivated MAPK signaling overriding the effect of BRAF inhibitor. In addition to the effects of TH1579 observed in BRAF-mutated CMM, TH1579 downregulates AXL and CAV-1 levels, resulting in improved efficacy of BRAF inhibitor treatment. cNRAS mutated CMM has upregulated AXL compared with BRAF mutated and WT CMM and TH1579 treatment reduces the level of AXL, hinder AKT signaling, induces ROS, causes DNA damage, mitotic arrest and cancer cell death. d By overexpressing AXL in WT and BRAF-mutated CMM, increased ROS levels and improved efficacy following TH1579 treatment was observed.

Acknowledgments
This image is the copyrighted work of the attributed author or publisher, and ZFIN has permission only to display this image to its users. Additional permissions should be obtained from the applicable author or publisher of the image. Full text @ Cell Death Differ.