|
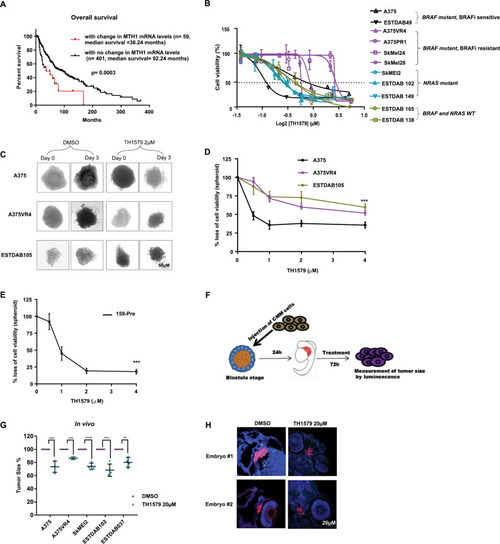
CMM cells are sensitive to MTH1 inhibitor TH1579 independent of <italic>BRAF/NRAS</italic> mutational status.a High MTH1 mRNA expression significantly decreases overall survival in CMM patients (n = 460) (data analyzed from TCGA). b Cell viability measured by MTS following 72 h treatment with TH1579 shows that NRAS, BRAF mutated and WT CMM are sensitive to TH1579 treatment. CMM cells with acquired or intrinsic resistance to vemurafenib have higher IC50 values for TH1579. (Error bars represent mean ± SEM; n = 3). c Representative images taken before (day 0) and after 72 h (day 3) of treatment showing the effects of 2 µM TH1579 on CMM spheroid compared with control (DMSO) treated spheroids. d After 72 h treatment with 0, 0.5, 1, 2 or 4 µM TH1579, the cell viability of the spheroids were measured by CellTiterGlo. (Error bars represent mean ± SD; n = 3, ***p < 0.001, two-way ANNOVA test). e Short-term patient-derived cell line, 159-Pre (BRAF WT) was cultured as spheroids and treated with TH1579 at concentrations shown in the figure. After 72 h treatment, cell viability was measured by CellTiterGlo. (Error bars represent mean ± SD; n = 3, ***p < 0.001, two-way ANNOVA test). f Schematic illustration of the experimental model of CMM transplanted zebrafish embryo disease model used in this study. Briefly, ~100 CMM cells stably expressing tdTomato and luciferase were injected into blastula of zebrafish embryo. The next day, embryos were screened for successful transplantation, and distributed into six-well plates (15 embryos/well). TH1579 was added directly to the medium to a final concentration of 20 or 40 μM. After 72 h, individual embryos were lysed and amount of CMM cells (i.e., tumor volume) were measured by luminescence. g TH1579 (20 μM) significantly reduces tumor volume in CMM transplanted zebrafish embryo disease model. Tumor size calculated as % of reduction of DMSO control. Data shown as mean ± SD from n = 4 independent experiments (Error bars represent mean ± SD, **p < 0.01, ***p < 0.001, ****p < 0.0001, Student’s t test). h Loss of Ki67 signal shown by IF of zebrafish embryo sections transplanted with SkMel2 collected after 72 h treatment with TH1579 (20 µM).
|