|
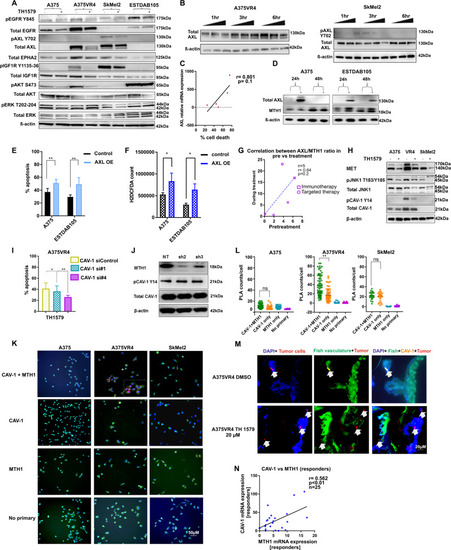
AXL and CAV-1 mediate sensitivity of CMM cells towards TH1579.a Representative image of western blot without (−) and with (+) 24 h treatment of 0.9 µM TH1579 in CMM cells. b Short-term (1, 3, and 6 h) treatment with TH1579 (0.3 and 0.9 µM) downregulates AXL in AXL overexpressing CMM cells as seen in representative image of western blot. c Cells with higher AXL mRNA expression have tendency to be more sensitive to TH1579. Data are obtained from Figs. 2g and 5a and plotted as correlation between AXL expression (normalized to loading control) and % apoptosis (Annexin V staining, FACS). d AXL overexpression was done in CMM cells with endogenous low AXL. The image is a representative western blot from n = 2 independent experiments. e Overexpression of AXL triggers sensitivity towards TH1579. Overexpression was done in CMM cells with low AXL (A375, ESTDAB105) for 24 h followed by 24 h treatment with 0.9 µM TH1579 and apoptosis measured by using FACS staining for Annexin V+, PI+. (error bars represent mean ± SD; n = 3; *p < 0.05, **p < 0.01, ***p < 0.001, Student's t test). f ROS measurement by H2DCFDA assay confirms that ROS is induced in both cell lines upon AXL overexpression (O.E) compared with control cells. (error bars represent mean ± SD; n = 3; *p < 0.05, **p < 0.01, ***p < 0.001, Student's t test). g Ratio of AXL and MTH1 expression correlate positively, although not significant (r = 0.64, p = 0.2) in CMM patients on comparing matched pretreatment samples to those taken during treatment (immunotherapy or targeted therapy) (n = 5). h Representative western blot image of n = 2 independent experiments. CAV-1 which is highly expressed in A375VR4 is downregulated after 24 h treatment with 0.9 µM TH1579 compared with control treated cells. Also MET and JNK1 (MAPK8) are downregulated compared with control cells. i Knockdown of CAV-1 (siRNA#1 and #4) decreases TH1579 sensitivity as analyzed by Annexin V staining using FACS in A375VR4 CMM cells (error bars represent mean ± SD; n = 3; *p < 0.05, **p < 0.01, ***p < 0.001, Student's t test). j shMTH1 (sh2 and sh3) does not reduce CAV-1 expression in A375VR4. Contrary to the inhibitor, knockdown of MTH1 alone does not decrease CAV-1 expression levels as seen by western blot (Data shown as a representative western blot image, n = 2). k Proximity Ligation Assay (PLA) shows CAV-1 and MTH1 interact in A375VR4. Analysis by PLA indicates that MTH1 and CAV-1 interacts only in A375VR4 and not in A375 or SKMel2. Data shown as a representative image, n = 2. l Quantification of (K) (error bars represent mean ± SD; n = 2; *p < 0.05, **p < 0.01, ***p < 0.001, Student's t test). m Treatment with TH1579 (20 µM) decreases expression of CAV-1 in an A375VR4 zebrafish disease model as seen by IF. n CAV-1 expression correlates to MTH1 expression in CMM patients both in responders to targeted and immunotherapy (n = 25). Sample set previously used in [44] (*p < 0.05, Student's t test).
|