IMAGE

Fig. 3

ID
ZDB-IMAGE-200625-3
Source
Figures for Das et al., 2020
Image
Figure Caption

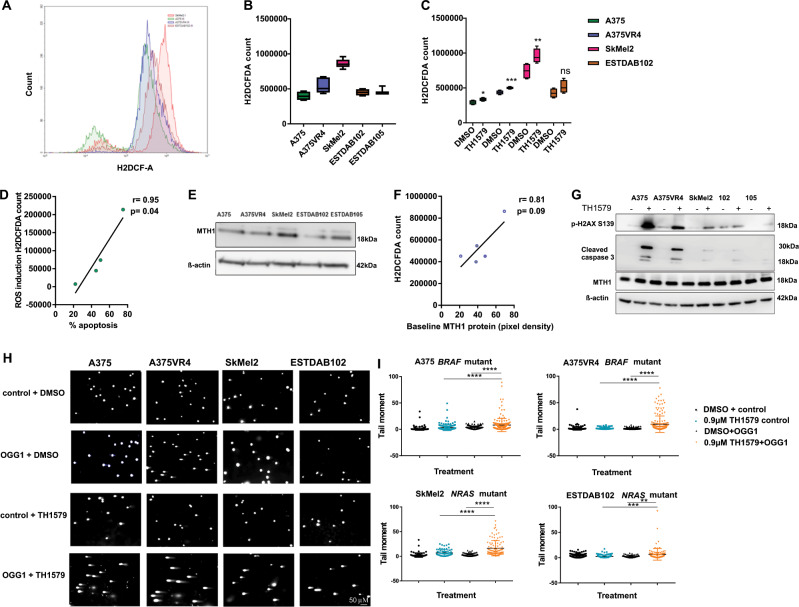
Fig. 3 TH1579 induces ROS leading to increased DNA damage in CMM cells.

a FACS plot showing differences in baseline ROS levels across CMM cells as measured by H2DCFA counts. b Quantification of a (error bars represent mean ± SD; n = 3). c CMM cells treated for 3 h with TH1579 (0.9 µM) displays elevated ROS levels using H2DCFA assay (error bars represent mean ± SD; n = 3; *p < 0.05, **p < 0.01, ***p < 0.001, ns: not significant, Student's t test). d TH1579 induced ROS (data shown in c) is positively correlated with percentage of apoptosis (data obtain in Fig. 2g) after drug treatment. e Representative image from western blot showing baseline MTH1 expression levels in CMM cells. f A positive trend, however not significant, is found between baseline MTH1 expression (data obtained from e) and ROS levels (data obtained from b) in CMM cells. g Representative image of western blot showing that 24 h treatment with 0.9 µM TH1579 (n = 3) increases p-H2AX signal (DNA damage marker) and cleaved caspase 3 (apoptosis marker) in CMM cells. h Representative images of modified comet assay in CMM cells (A375, A375VR4, and ESTDAB102) treated with TH1579 (0.9 µM) and SkMel2 treated with 0.6 µM TH1579. Comets are treated without (control) and with OGG1 to identify 8-oxodG. i Quantification of h (error bars represent mean ± SD; n = 3; *p < 0.05, **p < 0.01, ***p < 0.001, Student’s t test).

Acknowledgments
This image is the copyrighted work of the attributed author or publisher, and ZFIN has permission only to display this image to its users. Additional permissions should be obtained from the applicable author or publisher of the image. Full text @ Cell Death Differ.