FIGURE SUMMARY
Title

Mitochondria in Embryogenesis: An Organellogenesis Perspective

Authors
Arribat, Y., Grepper, D., Lagarrigue, S., Richard, J., Gachet, M., Gut, P., Amati, F.
Source
Full text @ Front Cell Dev Biol

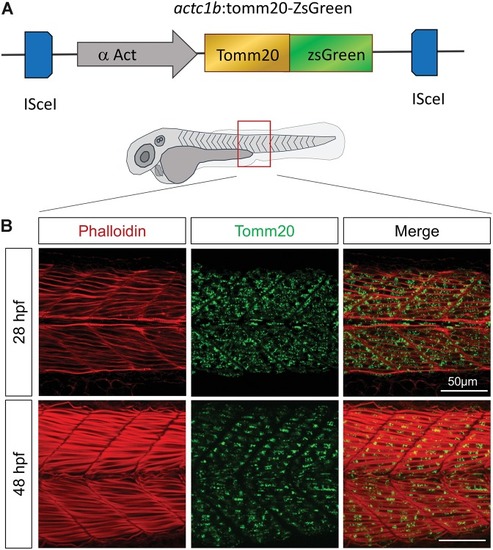
Tomm20-zsGreen transgenic zebrafish represent a relevant model to decipher mitochondrial modifications during embryogenesis. (A) Transgenic construct expressing zebrafish Tomm20 under the control of α Actin muscle specific promoter. (B) Confocal imaging of mitochondrial network (Tomm20, green) at the limit of yolk extension corresponding to somites 15–17, counterstained with Phalloidin (red) at 28 and 48 hpf. See also Supplementary Figure S1.

EXPRESSION / LABELING:
Gene:
Fish:
Anatomical Term:
Stage Range: Prim-5 to Long-pec

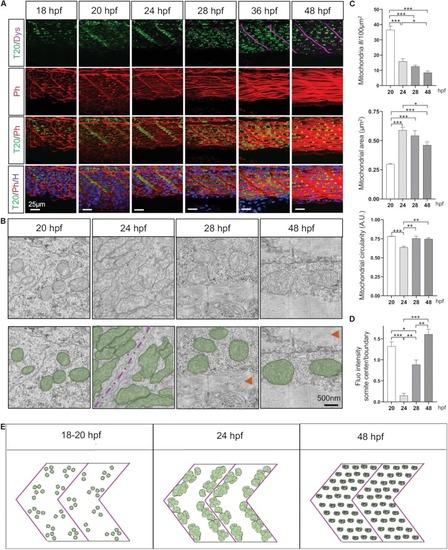
Mitochondria network adaptation follows three patterns of change through embryogenesis. (A) Confocal imaging of mitochondrial network (Tomm20, T20; green) counterstained with Phalloidin (Ph; red), Dystrophin (Dys; Magenta) and Hoescht (H; blue) at 18, 20, 24, 28, 36, and 48 hpf. Pictures taken at the limit of yolk extension (somites 15–17). (B) Electron micrographs of longitudinal sections at 20, 24, 28, and 48 hpf. Green overlays highlight mitochondria, red arrows indicate sarcomeric structures, magenta line is the separation between two somites. (C) Quantitative analyses of mitochondrial number, area and circularity at 20, 24, 28, and 48 hpf (n = 6 micrograph areas of 200 × 200 μm2 analyzed per group). (D) Quantification of Tomm20-zsGreen fluorescence ratio between somite center and boundary region at 20, 24, 28, and 48 hpf (n = 6 fish per group, 3 images analyzed per fish). (E) Cartoon depicts three distinct patterns presented by the mitochondrial network through embryogenesis. Bars are mean ± SEM. P < 0.05, ∗∗P < 0.01, ∗∗∗P < 0.001, one way repeated measures ANOVA with Tukey HSD post hoc test. See also Supplementary Figures S2S5 and Supplementary Video S1.

EXPRESSION / LABELING:
Gene:
Fish:
Anatomical Term:
Stage Range: 14-19 somites to Long-pec

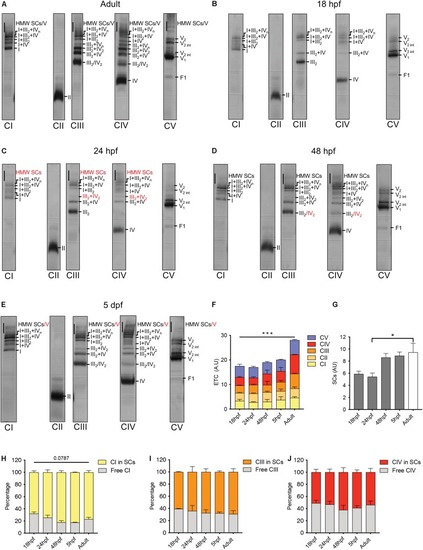
Electron transport chain supercomplexes are qualitatively stable throughout zebrafish development. (A–E) Representative BN-PAGE experiment with mitochondrial extracts from adult fish (6 months), 18, 24, 48 hpf, and 5 dpf. Specific antibodies against individual ETC complexes were used separately. Red numbers correspond to new bands appearing at particular time points. HMW is high molecular weight, int is intermediate. (F) Quantification of individual ETC complexes. Each value represents the signal on the immunoblot for each ETC complex (n = 2, each n with 250 embryos per group). (G) Quantification of supercomplexes (SCs). Each value represents the sum of all SCs bands including III2 + IV, III2 + IV2, I + III2, I + IV, I + III2 + IV, I + III2 + IVn and HMW SCs (n = 2, each n with 250 embryos per group). (H–J) Quantification of the percentage of CI, CIII, and CIV in free form and in SCs (n = 2, each n with 250 embryos per condition). Bars are mean ± SEM. P < 0.05, ∗∗∗P < 0.001, two way repeated measures ANOVA (line is effect of time) or one way repeated measures ANOVA with Tukey HSD post hoc comparison (bracket). See also Supplementary Figure S6.

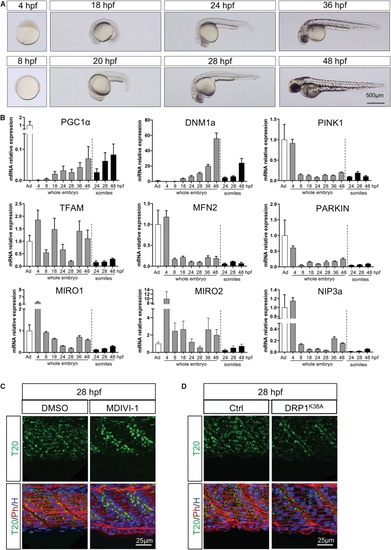
Temporal configuration of mitochondrial biogenesis, fusion, fission, mitophagy and transport through embryogenesis. (A) Representative pictures illustrate the different stages of zebrafish development used for quantitative RT-PCR. (B) Gene expression of key mitochondrial actors in whole embryos or dissected somites. Values are estimated using the 2–ΔΔCT method. Gene expression is normalized to 18S and compared to adult zebrafish muscle (bars are mean ± SEM). (C) Confocal imaging of mitochondrial network (Tomm20, T20; green) counterstained with Phalloidin (Ph; red) and Hoescht (H; blue) at 28 hpf in presence or absence of the fission inhibitor MDIVI-1 incubated since 24 hpf. (D) Confocal imaging of mitochondrial network (Tomm20, T20; green) counterstained with Phalloidin (Ph; red) and Hoescht (H; blue) at 28 hpf in embryos injected with mRNA encoding for the dominant negative DRP1 or with a mock at the one-cell stage zygote.

Neuronal stimulation and muscle contractions do not mediate mitochondrial patterning. (A) Confocal imaging of mitochondrial network (Tomm20, T20; green) counterstained with a marker for neuromuscular junctions αBungarotoxin (αBung; red) and a marker for primary motor neurons (ZNP1; magenta) at 24 and 48 hpf. While T20 signal corresponds to a unique confocal stack, αBung and ZNP1 represent the Z project. (B) Confocal imaging of mitochondrial network (Tomm20, T20; green) counterstained with αBungarotoxin (αBung; red) and primary motor neurons (ZNP1; magenta) at 28 hpf, with or without intravenous injection of αBungarotoxin performed at 24 hpf. (C) Confocal imaging of mitochondrial network (Tomm20, T20; green) counterstained with Phalloidin (Ph; red) at 24 hpf, with or without electrical pulse stimulation (EPS) applied at 20 hpf. (D) Confocal imaging of mitochondrial network (Tomm20, T20; green) counterstained with Phalloidin (Phall; red) at 28 hpf, with or without electrical pulse stimulation (EPS) applied at 24 hpf. (E) Quantification of Tomm20-zsGreen fluorescence ratio between somite center and boundary region at 24 and 28 hpf after 4 h of EPS (n = 6 fish per group, 3 images analyzed per fish).

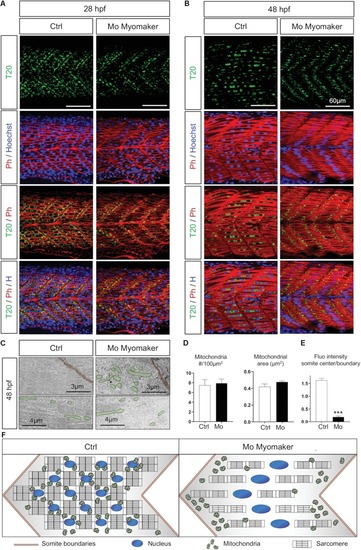
Mitochondrial network maturation is conditional to myoblast fusion. (A,B) Confocal imaging of mitochondrial network (Tomm20, T20; green) counterstained with Phalloidin (Ph; red) and Hoescht (H; blue) at 28 hpf (A) and 48 hpf (B); control (Ctrl, mock injection) or Myomaker-targeting Morpholinos (Mo Myomaker). (C) Electron micrographs of longitudinal sections at 48 hpf in control and Myomaker depleted embryos. Top images are close to boundaries, bottom images are at the somite center. (D) Quantification of mitochondrial number and area at 48 hpf from longitudinal electron micrographs (n = 6 micrographs for Ctrl, n = 7 micrographs for Mo). (E) Quantification of Tomm20-zsGreen fluorescence ratio between somite center and boundary region 48 hpf (n = 4 fish per group, 3 images analyzed per fish). (F) Cartoon representing somite structure and mitochondrial network at 48 hpf in control and Myomaker depletion. Bars are mean ± SEM. ∗∗∗P < 0.001, unpaired T-test.

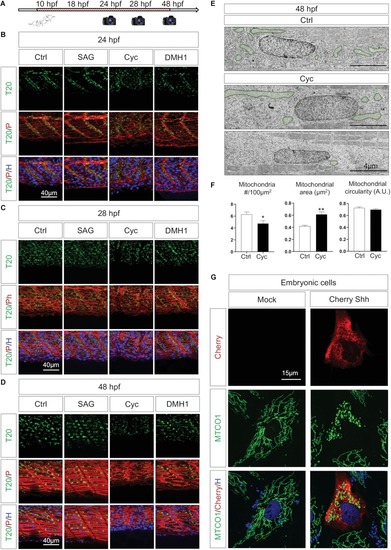
Shh signaling synchronizes tissue formation and mitochondria network maturation. (A) Pharmacological experiments design: agents were administered at 10 hpf, images captured at 24, 28, and 48 hpf. (B–D) Confocal imaging of mitochondrial network (Tomm20, T20; green) counterstained with Phalloidin (P; red) and Hoescht (H; blue) after administration of pharmacological agents to activate Shh signaling (SAG), inhibit Shh signaling (Cyclopamine, Cyc) or antagonize BMP signaling (DMH1) at 24 hpf (B), 28 hpf (C), and 48 hpf (D) in embryos submitted to the different drugs and in controls (Ctrl). (E) Electron micrographs of longitudinal sections at 48 hpf in Ctrl and Cyc treated embryo. Mitochondria are overlaid in green. (F) Quantification of mitochondria number, mean area and circularity at 48 hpf in Cyc treated embryos and Ctrl from longitudinal electron micrographs (n = 5 micrographs per group). (G) Confocal imaging of embryonic cells cultured from 10 hpf bud stage embryos either transfected with empty vector (Mock) or expressing Cherry-Shh. Mitochondria network is labeled with the component of complex IV MTCO1 (green), counterstained by Cherry (red) and Hoechst (H; blue). Bars are mean ± SEM. P < 0.05, ∗∗P < 0.01, unpaired T-test. See Supplementary Figure S7.

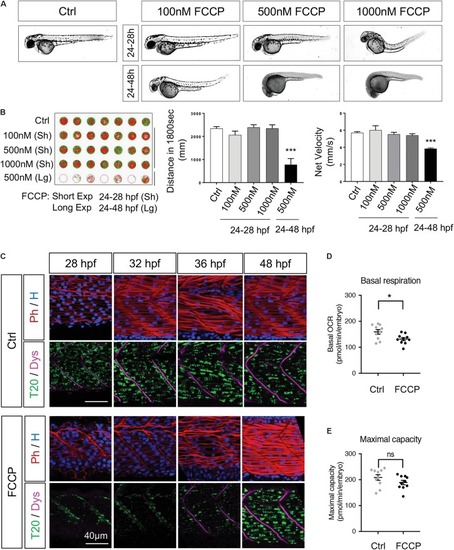
Mitochondrial quality is indispensable for embryogenesis. (A) Live embryos at 48 hpf after administration of FCCP with different doses and exposure durations. (B) Spontaneous locomotion in 5 dpf larvae after FCCP with different doses and durations. Slow velocity green lines are speeds between 3 and 6 mm/s. Fast velocity red lines are speeds > 6 mm/s (n = 12 fish per group). (C) Confocal imaging of mitochondrial network (Tomm20, T20; green) counterstained with Phalloidin (Ph; red), Dystrophin (Dys; magenta) and Hoescht (H; blue) with or without FCCP administration (500 nM from 24 to 28 hpf). (D,E) Basal respiration (D) and maximal respiration (E) in 48 hpf embryos with or without FCCP administration (500 nM from 24 to 28 hpf, n = 10 fish per group). Quantitative data are mean ± SEM. P < 0.05, ∗∗∗P < 0.0001, unpaired T-test compared to control embryos (Ctrl). See also Supplementary Figure S8 and Supplementary Videos S2, S3.

Acknowledgments
This image is the copyrighted work of the attributed author or publisher, and ZFIN has permission only to display this image to its users. Additional permissions should be obtained from the applicable author or publisher of the image. Full text @ Front Cell Dev Biol