FIGURE SUMMARY
Title

Endothelin signalling mediates experience-dependent myelination in the CNS

Authors
Swire, M., Kotelevtsev, Y., Webb, D.J., Lyons, D.A., Ffrench-Constant, C.
Source
Full text @ Elife

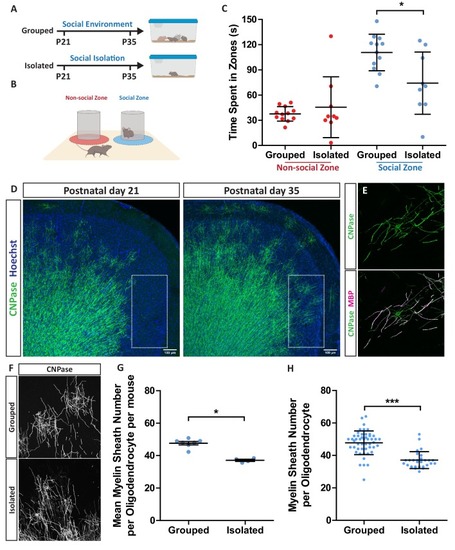
(A) Timeline for social isolation experiment. At postnatal day 21 male mice were housed in a social environment containing 3–5 mice or on their own in isolation. Mice were analysed at P35. (B) Schematic of social interaction assay. Mice were recorded for 5 min exploring an arena containing two identical wire mesh containers: one container housed an unrelated male wild type mouse (social zone), while the other remained empty (non-social zone). (C) Time spent within 2.5 cm of non-social container: Grouped 37.58 s ± 8.683 n = 12, Isolated 45.59 ± 36.28 n = 9 and social container: Grouped 110.7 s ± 21.71 n = 12, Isolated 74.24 s ± 37.07 n = 9 (mean ± standard deviation). Unpaired T-test p=0.0107. (D) Coronal section of mouse prefrontal cortex stained for CNPase and nuclei. Layers II/III of the medial prefrontal cortex outlined by dashed box. Scale bars = 100 μm. (E) Layer II/III oligodendrocyte stained for CNPase and MBP. (F) Representative images of medial prefrontal cortex oligodendrocytes stained for CNPase. (G) Mean number of myelin sheaths formed by oligodendrocytes per mouse. Grouped 47.66 ± 1.015 n = 7 mice, Isolated 37.11 ± 0.6425 n = 4 mice (mean ± standard error). Mann-Whitney test, p=0.0106. (H) Pooled data for number of myelin sheaths formed by layer II/III medial prefrontal cortex oligodendrocytes. Grouped 47.80 ± 7.289 n = 49 cells from seven mice, Isolated 37.11 ± 5.202 n = 28 cells from four mice (mean ± standard deviation). Mann-Whitney test, p=<0.001

Z-stack through a CNPase positive oligodendrocyte.

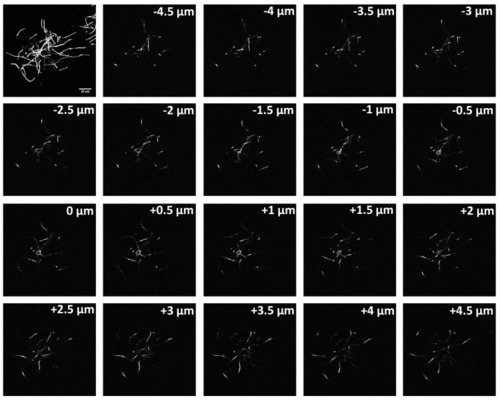
A full maximum intensity projection of a complete a layer II/III oligodendrocytes in mouse cortex stained for CNPase followed by 0.5 µm slices. Tracing the fine processes through each slice enables assessment of the myelin sheaths formed by individual oligodendrocytes.

Social isolation reduces oligodendrocyte generation in the mPFC.

(A) Distance travelled by mice during 5 min of exploration of the social interaction assay. Grouped 15.48 meters ± 3.326 n = 12 mice, Isolated 16.15 meters ± 3.57 n = 9 mice (mean ± standard deviation). (B) Maximum speed travelled by mice during 5 min of exploration of the social interaction assay. Grouped 0.2433 ± 0.04117 n = 12 mice, Isolated 0.2619 meters ± 0.02792 n = 9 mice (mean ± standard deviation). (C) Quantification of CNP positive cells in medial prefrontal cortex layers II/III: Grouped 7709 ± 378.7 n = 5 mice, Isolated 4738 ± 385.7 n = 4 mice (mean ± standard error). (D) Quantification of CNP positive cells in medial prefrontal cortex layer V: Grouped 18879 ± 1559 n = 9 mice, Isolated 13099 ± 1052 n = 9 mice (mean ± standard error). (E) Mean myelin sheath length formed by oligodendrocytes per mouse. Grouped 46.10 µm ± 2.485 n=seven mice, Isolated 51.48 µm ± 4.08 n=four mice (mean ± standard error). (F) Frequency distribution of myelin sheath lengths.

Loss of oligodendroglial EDNRB reduces myelin sheath number in the visual cortex where social isolation does not affect myelination or <italic>Edn1</italic> expression.

(A) Mean number of myelin sheath formed by oligodendrocytes per mouse. Wild type 52.57 ± 1.270 n = 4 mice, EDNRB CKO 42.39 ± 1.487 n = 4 mice, Isolated 50.32 ± 0.8755 n = 4 mice (mean ± standard error). Mann-Whitney test, p=0.0106. Kruskal-Wallis test, with Dunns post hoc. (B) Pooled data for number of myelin sheaths formed by layer II/III visual cortex oligodendrocytes. Grouped 52.57 ± 8.779 n = 28 cells from four mice, EDNRB CKO 42.39 ± 7.213 n = 28 cells from four mice, Isolated 50.32 ± 5.716 n = 28 cells from four mice (mean ± standard deviation). Kruskal-Wallis test, with Dunns post hoc. (C) Quantification of the number of Edn1 expressing Pecam1 positive cells. Grouped 0.6449 ± 0.02814 n = 4 mice, Isolated 0.63535 ± 0.02120 n = 4 mice (mean ± standard error). Mann-Whitney test.

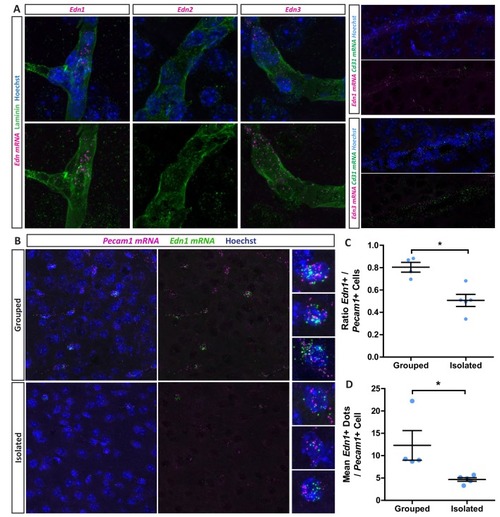
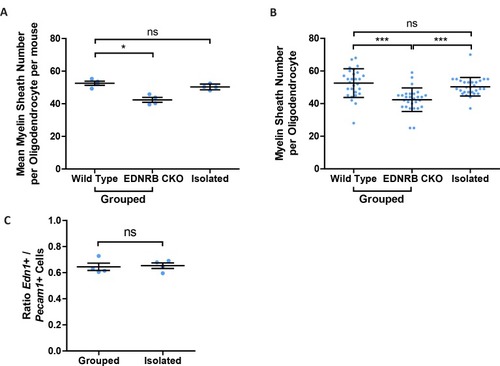
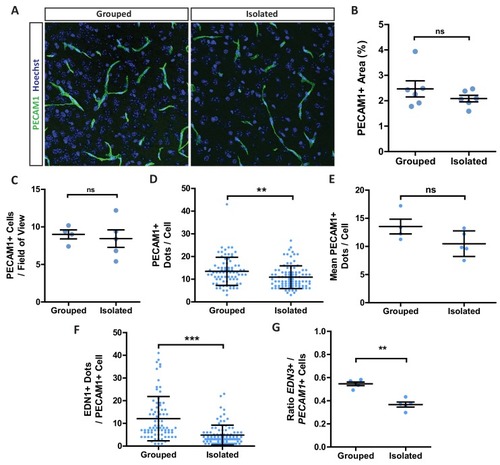
(A) Edn1 and Edn3 mRNA expression in laminin positive and CD31 positive blood vessels as revealed by RNAScope in situ hybridisation. (B) Representative images of Edn1 and Pecam1 mRNA expression in the mPFC. (C) Quantification of the number of Edn1 expressing Pecam1 positive endothelial cells. Grouped 0.8033 ± 0.04411 n = 4 mice, Isolated 0.5074 ± 0.05412 n = 5 mice (mean ± standard error). Mann-Whitney test, p=0.0159. (D) Quantification of the mean Edn1 mRNA molecules expressed by Pecam1 positive cells per mouse. Grouped 12.29 ± 3.312 n = 4 mice, Isolated 4.673 ± 0.4059 n = 5 mice (mean ± standard error). Mann-Whitney test, p=0.0159.

EDN mRNA is not expressed in astrocytes and microglia.

Expression of Edn1, Edn2 and Edn3 in S100β positive astrocytes and IBA1 positive microglia. (A) RNAScope in situ hybridisation for Edn1, Edn2 and Edn3 mRNA in the mouse medial prefrontal cortex stained for S100β positive astrocytes. Note that S100β positive cells are negative for Edn1 and Edn3 mRNA while positive Edn signal can be seen in S100β negative cells. (B) RNAScope in situ hybridisation for Edn1, Edn2 and Edn3 mRNA in the mouse medial prefrontal cortex stained for Iba1 positive microglia. Note that Iba1 positive cells are negative for Edn1 and Edn3 mRNA while positive Edn signal can be seen in Iba1 negative cells.

Social isolation does not affect medial prefrontal cortex vasculature.

(A) Representative images of medial prefrontal cortex vasculature staining for PECAM1. (B) Quantification of PECAM1 area in medial prefrontal cortex layer II/III: Grouped 2.468% ± 0.3156 n = 6 mice, Isolated 2.086 ± 0.13 n = 6 mice (mean ± standard error). Mann-Whitney test. (C) Quantification of number of Pecam1 mRNA expressing cells per field of view. Grouped 9 ± 0.5888 n = 4 mice, Isolated 8.44 ± 1.162 n = 4 mice (mean ± standard error). Mann-Whitney test. (D) Quantification of the number of Pecam1 mRNA molecules. Grouped 13.47 ± 6.204 n = 77 cells from four mice, Isolated 10.89 ± 5.02 n = 92 cells from five mice (mean ± standard deviation). Mann-Whitney test, p=0.002. (E) Quantification of the number of Pecam1 mRNA molecules per mouse. Grouped 13.53 ± 1.305 n = 4 mice, Isolated 10.48 ± 1.018 n = 5 mice (mean ± standard error). Mann-Whitney test. (F) Quantification of the number of Edn1 mRNA molecules in Pecam1 positive endothelial cells. Grouped 12.08 ± 9.759 n = 77 cells from four mice, Isolated 4.837 ± 4.406 n = 92 from five mice (mean ± standard deviation). Mann-Whitney test, p<0.0001. (G) Quantification of the number of Edn3 expressing Pecam1 positive endothelial cells. Grouped 0.5463 ± 0.01586 n = 5 mice, Isolated 0.3674 ± 0.02163 n = 5 mice (mean ± standard error). Mann-Whitney test, p=0.0079.

Conditional EDNRB knock out does not affect oligodendrocyte generation or myelin sheath length.

(A) Representative Images of Ednrb mRNA expressing Olig2 mRNA positive oligodendroglia. (B) Ratio of CC1 positive oligodendrocytes over total population of Olig2 positive oligodendroglia. Wild type 0.2086 ± 0.01087 n = 5 mice, EDNRB CKO 0.2003 ± 0.0248 n = 5 mice (mean ± standard error). (C) Number of CC1 and Olig2 positive oligodendrocytes. Wild type 1626 ± 170.6 n = 5 mice, EDNRB CKO 1419 ± 220.5 n = 5 mice (mean ± standard error). (D) Number Olig2 positive oligodendroglia. Wild type 7737 ± 903.8 n = 5 mice, EDNRB CKO 7565 ± 1239 n = 5 mice (mean ± standard error). (E) Mean myelin sheath length formed by oligodendrocytes per mouse. Wild type 46.10 µm ± 2.485 n=seven mice, EDNRB CKO 49.64 µm ± 4.688 n=four mice (mean ± standard error). (F) Frequency distribution of myelin sheath lengths. (G) Distance travelled by mice during 5 min of exploration of the social interaction assay. Wild type 15.48 meters ± 3.326 n = 12 mice, EDNRB CKO 17.62 meters ± 3.677 n = 9 mice (mean ± standard deviation). (H) Maximum speed travelled by mice during 5 min of exploration of the social interaction assay. Wild type 0.2433 ± 0.04117 n = 12 mice, EDNRB CKO 0.2748 meters ± 0.05095 n = 14 mice (mean ± standard deviation).

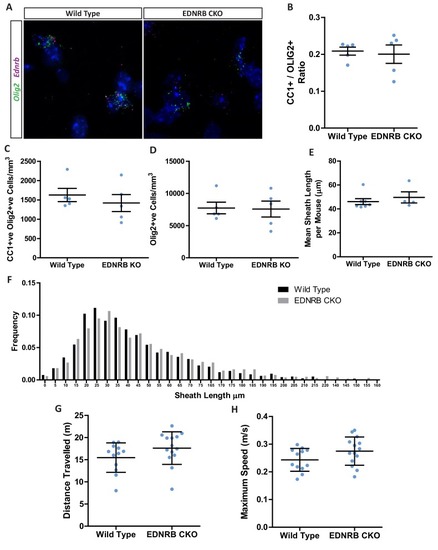
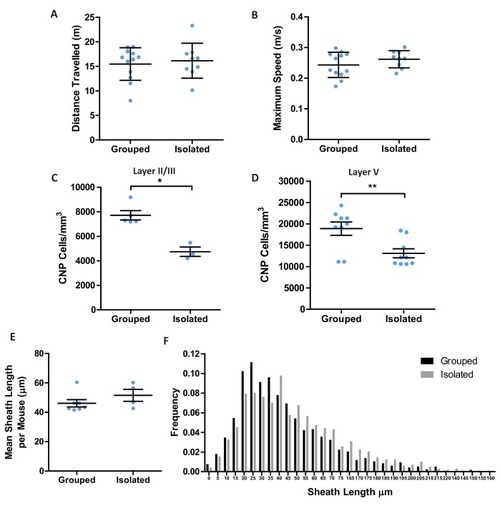
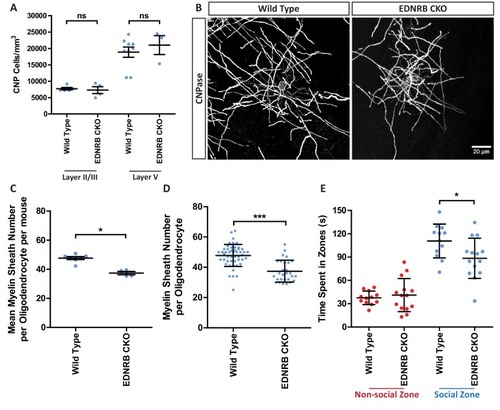
(A) Quantification of CNP positive cells in medial prefrontal cortex layers II/III: Wild type 7709 ± 378.7 n = 5 mice, EDNRB CKO 7288 ± 1054 n = 4 mice (mean ± standard error) and layer V: Wild type 18879 ± 1559 n = 9 mice, EDNRB CKO 21016 ± 2878 n = 3 mice (mean ± standard error). Mann Whitney test, layer II/III p=0.9048, layer V p=0.3527. (B) Representative images of medial prefrontal cortex oligodendrocytes stained for CNPase. Scale bar = 20 μm. (C) Mean number of myelin sheath formed by oligodendrocytes per mouse. Wild type 47.66 ± 1.015 n = 7 mice, EDNRB CKO 37.39 ± 1.099 n = 4 mice (mean ± standard error). Mann-Whitney test, p=0.0106. (D) Pooled data for number of myelin sheaths formed by layer II/III medial prefrontal cortex oligodendrocytes. Wild type 47.80 ± 7.289 n = 49 cells from seven mice, EDNRB CKO 37.39 ± 7.208 n = 28 cells from four mice (mean ± standard deviation). Mann-Whitney test, p=<0.001. (E) Time spent within 2.5 cm of non-social container: Wild type 37.58 s ± 8.683 n = 12, EDNRB CKO 41.06 ± 21.29 n = 14 and social container: Wild type 110.7 s ± 21.71 n = 12, EDNRB CKO 88.39 s ± 25.79 n = 14 (mean ± standard deviation). Unpaired T-test p=0.0267

EDNRB enhances myelin sheath number in vitro.

(A) Representative images of MBP positive oligodendrocytes in microfiber culture. Scale bar = 50 μm. (B) Mean number of myelin sheaths formed by rat oligodendrocytes on microfibers per independent culture preparation. Control 7.253 ± 0.4258 n = 8 independent cultures, BQ3020 11.21 ± 0.58635 n = 7 independent cultures, BQ788 6.026 ± 0.7046 (mean ± standard error) n = 4 independent cultures. 1-way ANOVA with Tukey’s post hoc test. (C) Pooled data for number of myelin sheaths formed by rat oligodendrocytes on microfibers. Control 7.194 ± 3.544 n = 160 cells from eight independent cultures, BQ3020 11.25 ± 4.420 n = 127 from seven independent cultures, BQ788 6.024 ± 3.059 n = 85 cells from four independent cultures (mean ± standard deviation). Kruskal-Wallis test, with Dunns post hoc. (D) Frequency distribution of myelin sheath lengths formed on microfibers. (E) qPCR for EDNRB from mouse oligodendrocyte cultures. Wild type 1.292 ± 0.04933 n = 4 independent cultures, EDNRB CKO 0.5958 ± 0.1117 n = 4 independent cultures, BQ788 6.026 ± 0.7046 (mean ± standard error). Unpaired T-test p=0.0013. (F) Mean number of myelin sheaths formed by mouse oligodendrocytes on microfibers per independent culture preparation. Wild type 6.18 ± 0.2082 n = 5 independent cultures, Wild type + BQ3020 9.732 ± 0.07548 n = 4 independent cultures, EDNRB CKO 5.380 ± 0.4181 n = 5 independent cultures, EDNRB CKO + BQ3020 5.989 ± 0.6125 n = 4 independent cultures (mean ± standard error). 1-way ANOVA. (G) Pooled data for number of myelin sheaths formed by mouse oligodendrocytes on microfibers. Wild type 6.138 ± 1.499 n = 65 cells from five independent cultures, Wild type + BQ3020 9.705 ± 2.575 n = 44 from 4independent cultures, EDNRB CKO 5.345 ± 1.824 n = 65 cells from 5independent cultures, EDNRB CKO + BQ3020 5.955 ± 2.632 n = 44 cells from four independent cultures (mean ± standard deviation). Kruskal-Wallis test, with Dunns post hoc.

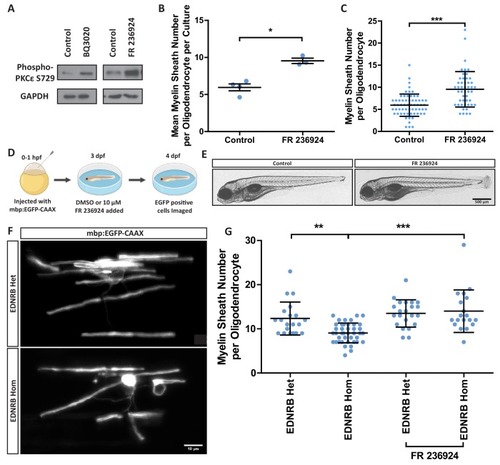
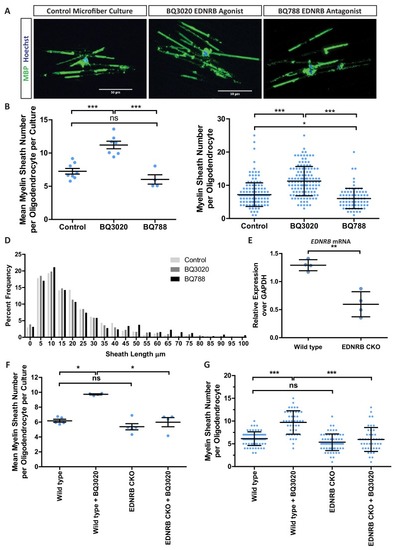
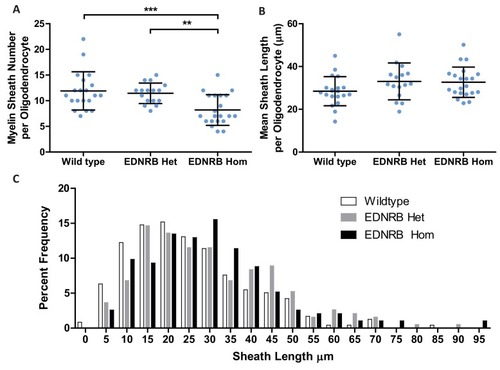
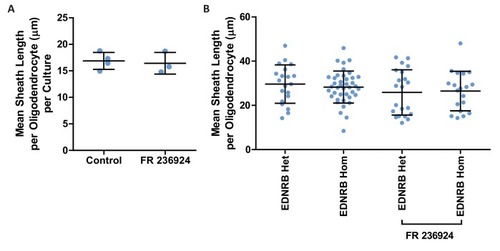
(A) Western blot images of rat oligodendrocytes treated with EDNRB agonist BQ3020 and PKCε agonist FR 236924 for 15 min. Antibodies used: Phosphorylated PKCε S729 and loading control GAPDH. (B) Mean number of myelin sheaths formed by rat oligodendrocytes on microfibers per experiment. Control 5.959 ± 0.4708 n = 4, FR 236924 9.542 ± 0.3614 n = 3 (mean ± standard error). Unpaired T-test p=0.0024. (C) Pooled data for number of myelin sheaths formed by rat oligodendrocytes on microfibers. Control 5.952 ± 2.525 n = 62 cells from four experiments, FR 236924 9.542 ± 4.016 n = 48 from three experiments (mean ± standard deviation). Mann-Whitney test, p=<0.001. (D) Schematic for zebrafish larvae treatment with FR 236924. (E) Representative images of 4 dpf zebrafish larvae treated with DMSO control or FR 236924. Scale bar = 500 μm. (F) Representative images of mbp:EGFP-CAAX oligodendrocytes in four dpf zebrafish larvae. Scale bar = 10 μm. (G) Pooled data for number of myelin sheaths formed by zebrafish oligodendrocytes. EDNRB Het 12.35 ± 3.746 n = 20 cells, EDNRB Hom (rse) 9.073 ± 2.229 n = 41 from four experiments, EDNRB Het + FR 236924 13.5 ± 3.098 n = 22 cells from five experiments, EDNRB Hom + FR 236924 14 ± 4.807 n = 19 cells (mean ± standard deviation). 1-way ANOVA

Global loss of EDNRB increases the number of oligodendrocytes in the zebrafish ventral spinal cord.

(A) Representative images of MBP positive oligodendrocytes in the zebrafish spinal cord. (B) Oligodendrocyte cell numbers in the dorsal tract: EDNRB Het 20.23 ± 5.639, EDNRB Hom 21.21 ± 7.138, ventral tract: EDNRB Het 39.09 ± 7.157, EDNRB Hom 45.47 ± 7.09 and total: EDNRB Het 59.32 ± 9.766, EDNRB Hom 66.79 ± 11.73. EDNRB Het n = 22, EDNRB Hom n = 14. T-test, Ventral p=0.0119, Total p=0.0463.

Global loss of EDNRB reduces the number of myelin sheath formed by zebrafish oligodendrocytes.

(A) Pooled data for number of myelin sheaths formed by zebrafish oligodendrocytes. Wild Type 11.9 ± 3.726 n = 20 cells, EDNRB Het 11.44 ± 1.999 n = 16 cells, EDNRB Hom 8.19 ± 2.994 n = 21 cells from four experiments, (mean ± standard deviation). 1-way ANOVA. (B) Pooled data for mean myelin sheath length formed by zebrafish oligodendrocytes. Wild Type 28.45 ± 6.8 n = 20 cells, EDNRB Het 33.04 ± 8.629 n = 16 cells, EDNRB Hom 32.65 ± 7.098 n = 21 from four experiments, (mean ± standard deviation). 1-way ANOVA. (C) Frequency distribution of myelin sheath length.

Protein kinase C epsilon activation does not affect myelin sheath length.

(A) Mean myelin sheath lengths formed by oligodendrocytes in microfiber cultures. Control 16.87 µm ± 0.7932, FR 16.42 µm ± 1.176 n = 3–4 (mean ± standard error). (B) Pooled data for number myelin sheath length formed by zebrafish oligodendrocytes. EDNRB Het 29.62 ± 8.685 n = 20 cells, EDNRB Hom 28.27 ± 7.242 n = 41 from, EDNRB Het + FR 236924 25.86 ± 10.25n = 21 cells, EDNRB Hom + FR 236924 26.48 ± 8.951 n = 19 cells (mean ± standard deviation).

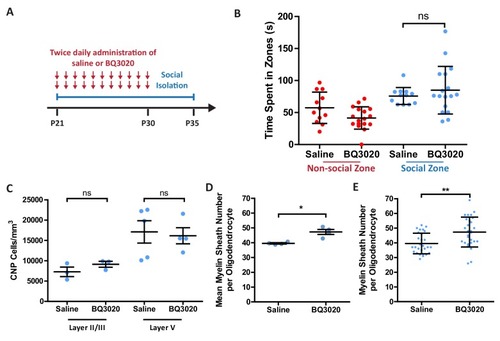
(A) Timeline for the intranasal experiment. At postnatal day 21 male mice were housed on their own in isolation. Mice were given two daily administrations of saline or EDNRB agonist BQ3020 from P21-P30. Mice were analysed at P35. (B) Time spent within 2.5 cm of non-social container: Saline 57.42 s ± 24.44 n = 12, BQ3020 41.44 ± 17.43 n = 17 and social container: Saline 75.82 s ± 13.26 n = 12, BQ3020 84.96 s ± 37.20 n = 17 (mean ± standard deviation). T-test. (C) Quantification of CNP positive cells in medial prefrontal cortex layers II/III: Saline 7278 ± 1165 n = 3 mice, BQ3020 9142 ± 713.3 n = 3 mice (mean ± standard error) and layer V: Saline 17114 ± 2750 n = 5 mice, BQ3020 16154 ± 1980 n = 4 mice (mean ± standard error). (D) Mean number of myelin sheath formed by oligodendrocytes per mouse. Saline 39.54 ±0.4301 n = 4 mice, BQ3020 47.29 ± 1.687 n = 4 mice (mean ± standard error). Mann-Whitney test, p=0.0286. (E) Pooled data for number of myelin sheaths formed by layer II/III medial prefrontal cortex oligodendrocytes. Saline 39.54 ±6.973 n = 28 cells from four mice, BQ3020 47.29 ± 10.18 n = 28 cells from seven mice (mean ± standard deviation). Mann-Whitney test, p=0.0019.

Intranasal administration of EDNRB agonist BQ3020 does not affect myelin sheath length.

(A) Distance travelled by mice during 5 minutes of exploration of the social interaction assay. Saline 17.48 meters ± 2.697 n = 12 mice, BQ3020 17.13 meters ± 35.209 n = 17 mice (mean ± standard deviation). (B) Maximum speed travelled by mice during 5 min of exploration of the social interaction assay. Saline 0.2769 ± 0.03276 n = 12 mice, BQ3020 0.2773 meters ± 0.05085 n = 17 mice (mean ± standard deviation). (C) Mean myelin sheath length formed by oligodendrocytes per mouse. Saline 59.38 µm ± 4.831 n = 28 cells from four mice, BQ3020 53.98 µm ± 5.748 n = 28 cells from four mice (mean ± standard deviation). (D) Frequency distribution of myelin sheath lengths.

Proposed model for how EDNRB regulates myelin sheath number.

(A) Summary of results from paper. In a social environment, EDN from the vasculature increases myelin sheath number in the medial prefrontal cortex, influencing sociability. In social isolation vascular EDN production is reduced, leading to a decreased number of myelin sheaths formed by oligodendrocytes and reduced sociability. Oligodendroglial knock out of EDNRB reduces the number of myelin sheaths formed by oligodendrocytes and reduced sociability. (B) Proposed hypothesis for how EDN signalling links neuronal activity to increased myelination and thus support of active axons. 1. Increased local neuronal activity signals to the vasculature to increase blood flow to the active area 2. The increased blood flow stimulates EDN production from endothelial cells 3. Increased EDN levels leads to the formation of more myelin sheaths by oligodendrocytes. Figures created with Biorender.

Acknowledgments
This image is the copyrighted work of the attributed author or publisher, and ZFIN has permission only to display this image to its users. Additional permissions should be obtained from the applicable author or publisher of the image. Full text @ Elife