
|
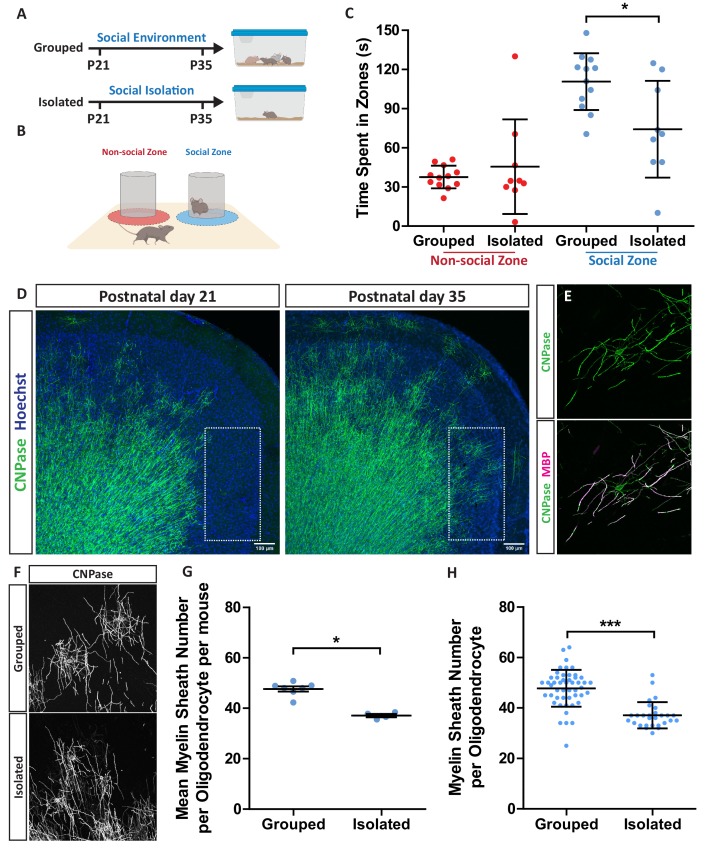
Figure 1 (A) Timeline for social isolation experiment. At postnatal day 21 male mice were housed in a social environment containing 3–5 mice or on their own in isolation. Mice were analysed at P35. (B) Schematic of social interaction assay. Mice were recorded for 5 min exploring an arena containing two identical wire mesh containers: one container housed an unrelated male wild type mouse (social zone), while the other remained empty (non-social zone). (C) Time spent within 2.5 cm of non-social container: Grouped 37.58 s ± 8.683 n = 12, Isolated 45.59 ± 36.28 n = 9 and social container: Grouped 110.7 s ± 21.71 n = 12, Isolated 74.24 s ± 37.07 n = 9 (mean ± standard deviation). Unpaired T-test p=0.0107. (D) Coronal section of mouse prefrontal cortex stained for CNPase and nuclei. Layers II/III of the medial prefrontal cortex outlined by dashed box. Scale bars = 100 μm. (E) Layer II/III oligodendrocyte stained for CNPase and MBP. (F) Representative images of medial prefrontal cortex oligodendrocytes stained for CNPase. (G) Mean number of myelin sheaths formed by oligodendrocytes per mouse. Grouped 47.66 ± 1.015 n = 7 mice, Isolated 37.11 ± 0.6425 n = 4 mice (mean ± standard error). Mann-Whitney test, p=0.0106. (H) Pooled data for number of myelin sheaths formed by layer II/III medial prefrontal cortex oligodendrocytes. Grouped 47.80 ± 7.289 n = 49 cells from seven mice, Isolated 37.11 ± 5.202 n = 28 cells from four mice (mean ± standard deviation). Mann-Whitney test, p=<0.001