
Image
|
Figure Caption
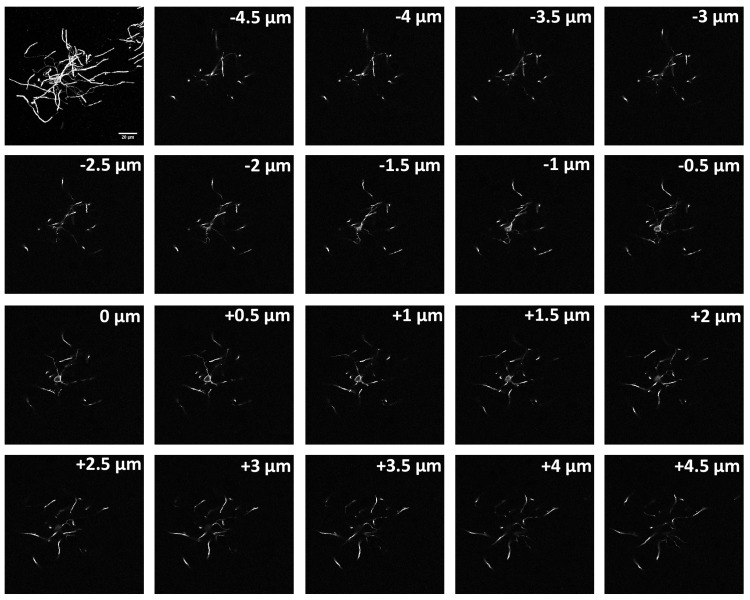
Figure 1—figure supplement 1.
A full maximum intensity projection of a complete a layer II/III oligodendrocytes in mouse cortex stained for CNPase followed by 0.5 µm slices. Tracing the fine processes through each slice enables assessment of the myelin sheaths formed by individual oligodendrocytes.
Acknowledgments
This image is the copyrighted work of the attributed author or publisher, and
ZFIN has permission only to display this image to its users.
Additional permissions should be obtained from the applicable author or publisher of the image.
Full text @ Elife