
- Title
-
Transcriptional autoregulation of zebrafish tbx6 is required for somite segmentation
- Authors
- Ban, H., Yokota, D., Otosaka, S., Kikuchi, M., Kinoshita, H., Fujino, Y., Yabe, T., Ovara, H., Izuka, A., Akama, K., Yamasu, K., Takada, S., Kawamura, A.
- Source
- Full text @ Development
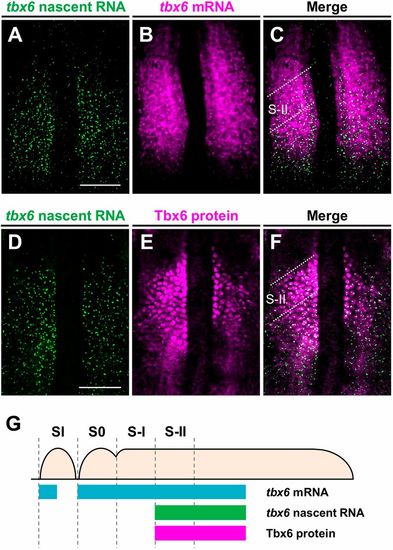
The anterior border of the expression domain of tbx6 nascent transcripts overlaps with the anterior border of the Tbx6 domain in the anterior PSM of zebrafish embryos. (A-C) Two-color fluorescent in situ hybridization was performed to compare the expression patterns of de novo tbx6 RNA (green; A) and mature tbx6 mRNA (magenta; B) in the PSM of wild-type embryos at the 10- to 12-somite stage (n=4). (D-F) Distributions of tbx6 nascent transcripts (green; D) and Tbx6 proteins (magenta; E) in the PSM of wild-type embryos at the 10- to 12-somite stage (n=4). Flat-mounted specimens after yolk removal. Dorsal view; anterior is to the top. Scale bars: 100 µm. (G) Schematic illustrations showing the expression domains of tbx6 mRNA, tbx6 nascent RNA and Tbx6 protein in the PSM. The forming somites are designated S0 and the following prospective somites in the PSM are shown in negative roman numerals (Pourquié and Tam, 2001). Distribution of tbx6 mRNA and Tbx6 protein are depicted as described previously (Nikaido et al., 2002; Wanglar et al., 2014). EXPRESSION / LABELING:
|
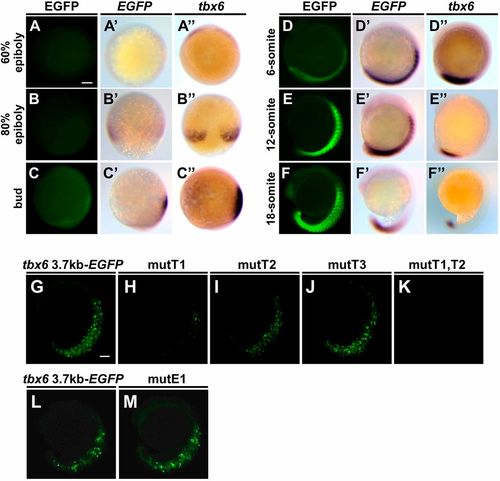
Two T-box binding sites proximal to tbx6 are necessary to drive reporter gene expression in the PSM of zebrafish embryos. (A-F) Expression patterns of EGFP signals and EGFP mRNA during embryogenesis in Tg(tbx6:EGFP) embryos (A-F; n=24). Whole-mount in situ hybridization was carried out to compare the distributions of EGFP mRNA (A′-F′; n=10) and endogenous tbx6 mRNA (A″-F″; n=10). Animal pole views (A-A″), dorsal views (B-B″) and lateral views (C-F″). All the photos are taken at the same magnification. Scale bar: 100 µm. (G-M) Several EGFP reporter genes that possess a base substitution of these binding sites were injected into zebrafish embryos to examine the cis-regulatory activities. The base substitutions introduced at T-box binding sites and the E-box site are shown below the corresponding sequences in Fig. S3A. EGFP fluorescent signal was observed at the 15- to 18-somite stages. Representative images are shown in lateral view. Detailed results are shown in Table S1. Scale bar: 100 µm. EXPRESSION / LABELING:
|
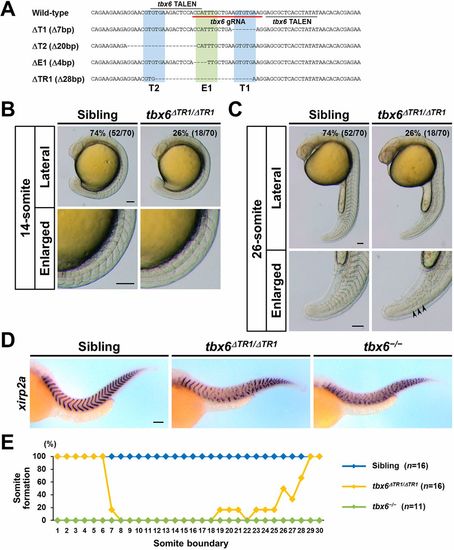
The TR1 located upstream of tbx6 is required for somite segmentation in zebrafish embryos. (A) Introduced deletions within TR1 in tbx6ΔT1, tbx6ΔT2, tbx6ΔE1 and tbx6ΔTR1 mutants. TALEN target sequences used to generate tbx6ΔT1 and tbx6ΔTR1 are indicated by gray lines. gRNA target sequences used to generate tbx6ΔT2 and tbx6ΔE1 mutants are underlined with a red line. (B,C) Live representative images of sibling and tbx6ΔTR1/ΔTR1 embryos obtained from intercross of tbx6+/ΔTR1 heterozygous fish. The percentage of embryos exhibiting the phenotype is shown in the top right corner. tbx6ΔTR1/ΔTR1 embryos exhibited the segmentation defects in the intermediate region of the embryonic body, whereas the phenotype of sibling embryos was indistinguishable from that of wild-type embryos. At the 26-somite stage, the recovery of the formation of the somite boundaries was detectable in tbx6ΔTR1/ΔTR1 embryos (39%, n=7). Arrowheads indicate the boundaries of tail somites in tbx6ΔTR1/ΔTR1. The allele of tbx6ΔTR1 is a recessive mutation, and tbx6ΔTR1/ΔTR1 adult fish are viable and fertile. Scale bars: 100 µm. (D) Expression patterns of a segment boundary marker, xirp2a, in sibling (n=16), tbx6ΔTR1/ΔTR1 (n=16) and tbx6−/− (n=11) at 36 hpf. (E) Distribution of somite boundary formation in sibling, tbx6ΔTR1/ΔTR1 and tbx6−/− embryos. Scoring of the somite boundary formation was carried out as described previously (Kinoshita et al., 2018). The somite number of the improperly formed somites was estimated based on their position in the wild-type embryonic body. EXPRESSION / LABELING:
PHENOTYPE:
|
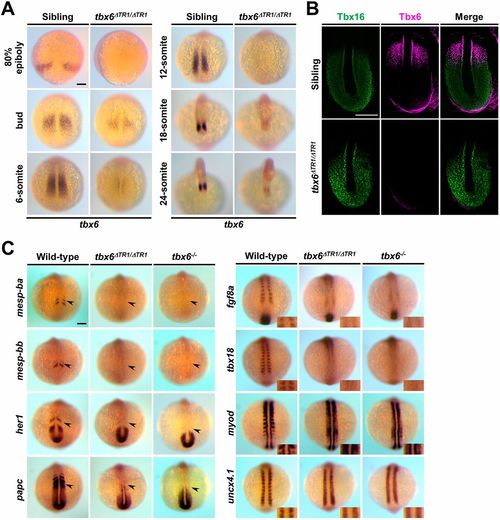
Homozygous deletion of TR1 significantly reduces the expression of tbx6 and leads to abnormal expression patterns of segmentation genes similar to tbx6 null mutants at the 12-somite stage. (A) Whole-mount in situ hybridization revealed the expression patterns of endogenous tbx6 in sibling (tbx6+/+; n=15) and tbx6ΔTR1/ΔTR1 (n=16) embryos during embryogenesis. All of the photos were taken at the same magnification from dorsal views. (B) Immunostaining of Tbx16 (green) and Tbx6 (magenta) in the PSM of sibling (n=5) and tbx6ΔTR1/ΔTR1 (n=6) embryos at the 12-somite stage. Dorsal views of flat-mount embryos after yolk removal. Anterior is towards the top. Around the posterior edge of the tailbud, a background signal was observed for Tbx6 signal. (C) Whole-mount in situ hybridization was performed to compare the expression patterns of genes involved in somite segmentation. Expression patterns of mesp-ba (wild type, n=11; tbx6ΔTR1/ΔTR1, n=11; tbx6−/−, n=9), mesp-bb (wild-type, n=11; tbx6ΔTR1/ΔTR1, n=11; tbx6−/−, n=9), her1 (wild-type, n=10; tbx6ΔTR1/ΔTR1, n=11; tbx6−/−, n=9), papc (wild-type, n=10; tbx6ΔTR1/ΔTR1, n=11; tbx6−/−, n=9), fgf8a (wild-type, n=11; tbx6ΔTR1/ΔTR1, n=11; tbx6−/−, n=9), tbx18 (wild-type, n=11; tbx6ΔTR1/ΔTR1, n=11; tbx6−/−, n=9), myod (wild-type, n=11; tbx6ΔTR1/ΔTR1, n=11; tbx6−/−, n=9) and uncx4.1 (wild-type, n=11; tbx6ΔTR1/ΔTR1, n=11; tbx6−/−, n=9) were analyzed at the 10- to 12-somite stage. The arrowheads indicate the expression of segmentation genes in the anterior PSM. Dorsal views. For the somite polarity marker, magnified views around the newly formed somites are shown in the inset. After in situ staining, the genotype of each embryo was determined. Scale bars: 100 µm. EXPRESSION / LABELING:
PHENOTYPE:
|
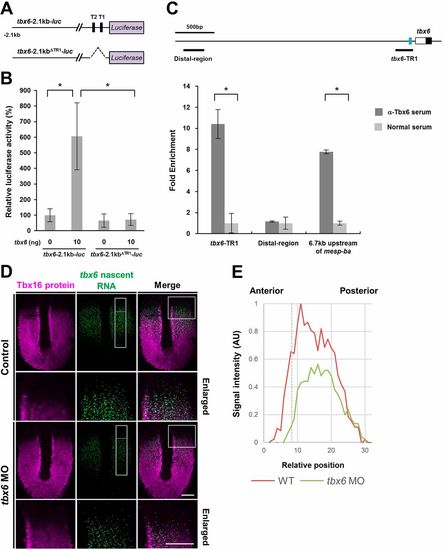
Transcriptional autoregulatory loop of tbx6: Tbx6 proteins are associated with T1 and T2 sites and activate the transcription of tbx6 in the anterior PSM. (A) Schematic illustrations showing the reporter genes used in the luciferase assay. (B) Luciferase assay showing the effects of tbx6 on reporter gene activities in HEK293T cells. The amounts of plasmids used for transfection are shown under each bar. The average normalized firefly luciferase activity with pCS2+ (mock) alone was set at 100%; error bars represent standard deviations. The differences of relative luciferase activity were statistically evaluated using Student's t-test. *P<0.05. Three independent experiments were performed to confirm the reproducibility. (C) ChIP assay revealed that Tbx6 proteins are preferentially associated with the TR1. Schematic representation of zebrafish tbx6 genomic locus is shown. The white box indicates the 5′UTR, the black box indicates the coding region in the first exon and the blue rectangle represents the location of TR1. The position of primers used for qPCR analysis is shown below the genomic locus. As a positive control, the genomic region located 6.7 kb upstream of mesp-ba, which was previously identified as a Tbx6-associated genomic region (Windner et al., 2015), was used. As a negative control, the genomic region that is located 3.1 kb upstream of tbx6 was used. ChIP analysis was performed twice from independent dissected posterior tissues of embryos at the 18- to 22-somite stage. qPCR analysis was carried out at least three times for each precipitated ChIP sample. (D) The expression domain of tbx6 nascent transcripts in tbx6 knockdown embryos. The expression domain of Tbx16 protein was co-stained to precisely define the posterior PSM. Dorsal view of flat-mounted species at the 10-somite stage. tbx6 knockdown embryos clearly showing segmental defects were used for analysis. Images around the anterior PSM (boxed regions) are shown enlarged. Scale bars: 100 µm. (E) Quantification of signal intensity of tbx6 nascent transcripts in the PSM of control and tbx6 knockdown embryos. In the boxed areas shown in D, the intensity of tbx6 nascent RNA signals along the anterior-posterior axis was measured using ImageJ, and the relative intensity was compared. Dashed line represents the anterior border of the expression domain of Tbx16. EXPRESSION / LABELING:
|
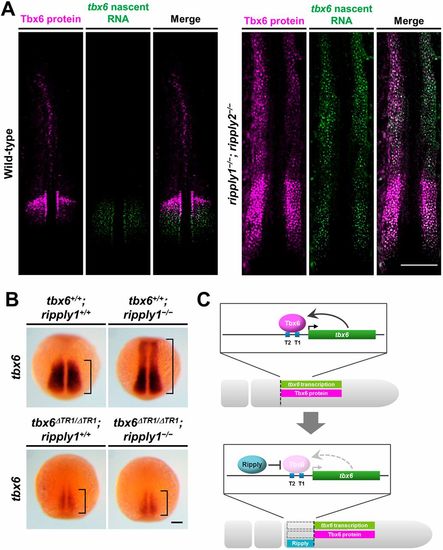
Deletion of TR1 significantly suppresses the ectopic expression of tbx6 caused by the loss of function of ripply1 in zebrafish. (A) Fluorescence in situ hybridization to examine the distribution of tbx6 nascent transcripts (green) and Tbx6 protein (magenta) in wild- type (n=3) and ripply1−/−; ripply2−/− (n=3) embryos at the 10-somite stage. Dorsal views of flat-mounted embryos. (B) Anterior expansion of tbx6 expression in ripply1−/− embryos was substantially suppressed in tbx6ΔTR1/ΔTR1; ripply1−/− embryos at the 3- to 5-somite stage. (C) Schematic illustrations of Ripply-mediated synchronous regression of the expression domains of Tbx6 protein and tbx6 transcription in the anterior PSM. Transcription of zebrafish tbx6 is maintained by Tbx6 itself through a single enhancer: TR1. Ripply-mediated degradation of Tbx6 protein leads to transcriptional termination of tbx6 in the PSM. Scale bars: 200 μm in A; 100 μm in B. EXPRESSION / LABELING:
PHENOTYPE:
|

ZFIN is incorporating published figure images and captions as part of an ongoing project. Figures from some publications have not yet been curated, or are not available for display because of copyright restrictions. EXPRESSION / LABELING:
PHENOTYPE:
|
|
ZFIN is incorporating published figure images and captions as part of an ongoing project. Figures from some publications have not yet been curated, or are not available for display because of copyright restrictions. EXPRESSION / LABELING:
PHENOTYPE:
|