
- Title
-
Synaptic-like Vesicles Facilitate Pioneer Axon Invasion
- Authors
- Nichols, E.L., Smith, C.J.
- Source
- Full text @ Curr. Biol.

ZFIN is incorporating published figure images and captions as part of an ongoing project. Figures from some publications have not yet been curated, or are not available for display because of copyright restrictions. EXPRESSION / LABELING:
|
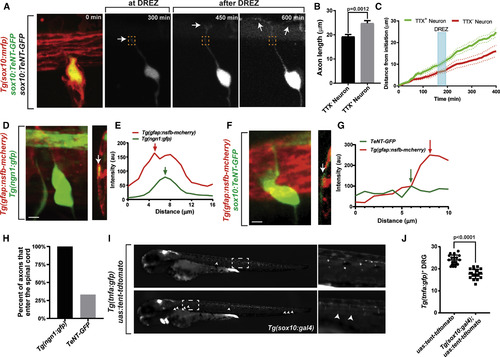
Inhibition of Vesicle Release Disrupts Pioneer Axon Targeting (A) Confocal z-projections of pioneer axon navigation in a Tg(sox10:gal4); Tg(uas:mcherry); uas:TeNT-gfp animal from a 24-h time-lapse starting at 48 hpf. Inhibition of vesicle release results in pioneer axon mistargeting past DREZ. White arrows denote growth cones. Dashed orange box denotes DREZ. (B) Axon length at 72 hpf of TENT− (n = 10) and TENT+ (n = 13) DRG. (C) Growth cone tracings of axon navigation in TENT− (red; n = 10) and TENT+ (green; n = 13) DRG. Blue box denotes DREZ. (D and F) Confocal z-projection and y-orthogonals of a Tg(ngn1:gfp); Tg(gfap:nsfb-mcherry) (D) and a Tg(gfap:nsfb-mcherry); uas:TeNT-gfp (F) animal. White arrows denote the location of the pioneer axon in relation to the glia limitans. (E and G) Representative intensity tracings from y-orthogonals in (D) and (F) showing the relation of the pioneer axon and glia limitans for TeNT+ (E) and TeNT− (F). Red arrows denote glia limitans, and green arrows denote pioneer axon. (H) Quantifications of DRG pioneer axon spinal cord entry at 72 hpf (n = 13 TENT−; n = 12 TENT+). (I) Images of Tg(tnfa:gfp) (top) and Tg(tnfa:gfp); Tg(sox10:gal4) (bottom) animals injected with uas:tent-tdtomato plasmids. White arrowheads denote Tg(tnfa:gfp)− DRG. Dashed white boxes denote inset shown on right. (J) Number of Tg(tnfa:gfp)+ DRG in uas:tent-tdtomato animals (n = 18) or in Tg(sox10:gal4); uas:tent-tdtomato animals (n = 20). SEM is shown. Student’s t test was used for (B) and (J). Scale bars, 10 μm EXPRESSION / LABELING:
|
|
ZFIN is incorporating published figure images and captions as part of an ongoing project. Figures from some publications have not yet been curated, or are not available for display because of copyright restrictions. EXPRESSION / LABELING:
PHENOTYPE:
|
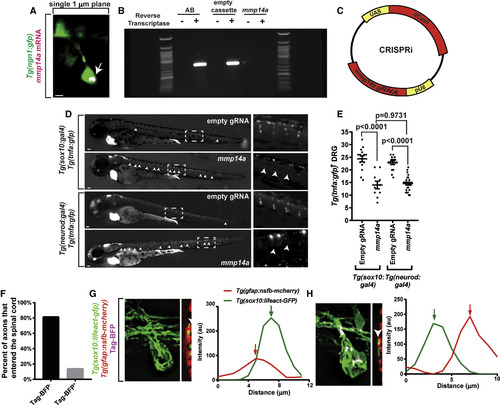
MMP14a Functions Cell Autonomously to Promote DRG Spinal Entry (A) Single-plane confocal image of RNAscope in situ hybridization of mmp14a in a Tg(ngn1:gfp) animal fixed at 54 hpf. Arrow denotes mmp14aexpression in DRG sensory neuron. (B) RT-PCR gel of mmp14a transcript in AB animals, animals expressing ubiquitous dCas9 and an empty gRNA cassette, and animals expressing ubiquitous dCas9 and gRNA targeting mmp14a. Reactions without reverse transcriptase are denoted. 50 bp ladder is used. (C) Diagram of the cell-specific CRISPRi plasmid. A kinase-dead Cas9 conjugated to kruppel associated box (KRAB) is expressed under a UAS promoter and a gRNA sequence is expressed under a ubiquitous U6 promoter, allowing for cell-specific gene silencing. (D) Images of Tg(tnfa:gfp); Tg(sox10:gal4) animals and Tg(tnfa:gfp); Tg(neurod:gal4) animals injected with CRISPRi plasmids with an empty gRNA cassette or gRNA targeting mmp14a. White arrowheads denote Tg(tnfa:gfp)− DRG. Dashed white boxes denote inset shown on right. (E) Number of Tg(tnfa:gfp)+ DRG in CRISPRi Tg(sox10:gal4) and Tg(neurod:gal4) animals with an empty gRNA cassette (n = 14 Tg(sox10:gal4); n = 15 Tg(neurod:gal4) animals) or mmp14a knockdown (n = 10 Tg(sox10:gal4); n = 26 Tg(neurod:gal4) animals). (F) Percent of tagBFP− DRG (n = 11) or tagBFP+ DRG (n = 14) that enter the spinal cord from (G) and (H). (G and H) Confocal z-projection and y-orthogonals of pioneer axon entry in Tg(gfap:nsfb-mcherry); Tg(sox10:lifeact-gfp) CRISPRi animals of tagBFP− (G) and tagBFP+ (H) DRG at 72 hpf. On right, intensity tracings of y-orthogonals show relationship of the pioneer axon and glia limitans. TagBFP+ DRG display an axon lateral to the glia limitans. Green arrows denote pioneer axon. Red arrows denote glia limitans. Tukey’s HSD test was used for (E). SEM is shown. EXPRESSION / LABELING:
|
|
ZFIN is incorporating published figure images and captions as part of an ongoing project. Figures from some publications have not yet been curated, or are not available for display because of copyright restrictions. EXPRESSION / LABELING:
|
|
ZFIN is incorporating published figure images and captions as part of an ongoing project. Figures from some publications have not yet been curated, or are not available for display because of copyright restrictions. EXPRESSION / LABELING:
PHENOTYPE:
|
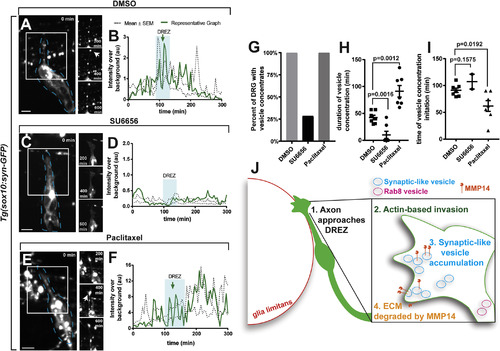
Modulation of Actin Structures Alters Vesicles at the DREZ (A, C, and E) Confocal z-projections of pioneer growth cone actin organization in Tg(sox10:syn-gfp) in animals treated with DMSO (A), SU6656 (C), and paclitaxel (E) from a 24-h time lapse starting at 48 hpf. White arrows denote actin concentrations at DREZ. White box denotes insets on right. Dashed blue lines denote DRG tracings. Note: fluorescence outside of white box in (E) is a spinal oligodendrocyte. (B, D, and F) Growth cone Syn-GFP intensity tracings throughout navigation in DMSO (B; n = 6), SU6656 (D; n = 7), and paclitaxel (F; n = 7) DRG. Inhibition of actin-based invasion abrogates Syn-GFP accumulation, and promotion of actin-based invasion generates robust Syn-GFP accumulation. Green line denotes representative graph. Dashed black line denotes mean ± SEM. Blue box denotes DREZ. (G) Percent of axons that demonstrate vesicle accumulations at DREZ (n = 6 DMSO; n = 7 SU6656; n = 7 paclitaxel). (H and I) Duration (H) and time of initiation (I) of vesicle concentrates at the DREZ showing changes in vesicles when actin invasion is altered (n = 6 DMSO; n = 7 SU6656; n = 7 paclitaxel). (J) Model of actin and synaptic-like vesicle coordinated invasion of the spinal cord by DRG pioneer axons. SEM is shown. Tukey’s HSD was used for (H) and (I). EXPRESSION / LABELING:
PHENOTYPE:
|