
Fig. 2
- ID
- ZDB-IMAGE-191021-8
- Genes
- Publication
- Nichols et al., 2019 - Synaptic-like Vesicles Facilitate Pioneer Axon Invasion
- All Figures
- Figures for Nichols et al., 2019
|
Fig. 2
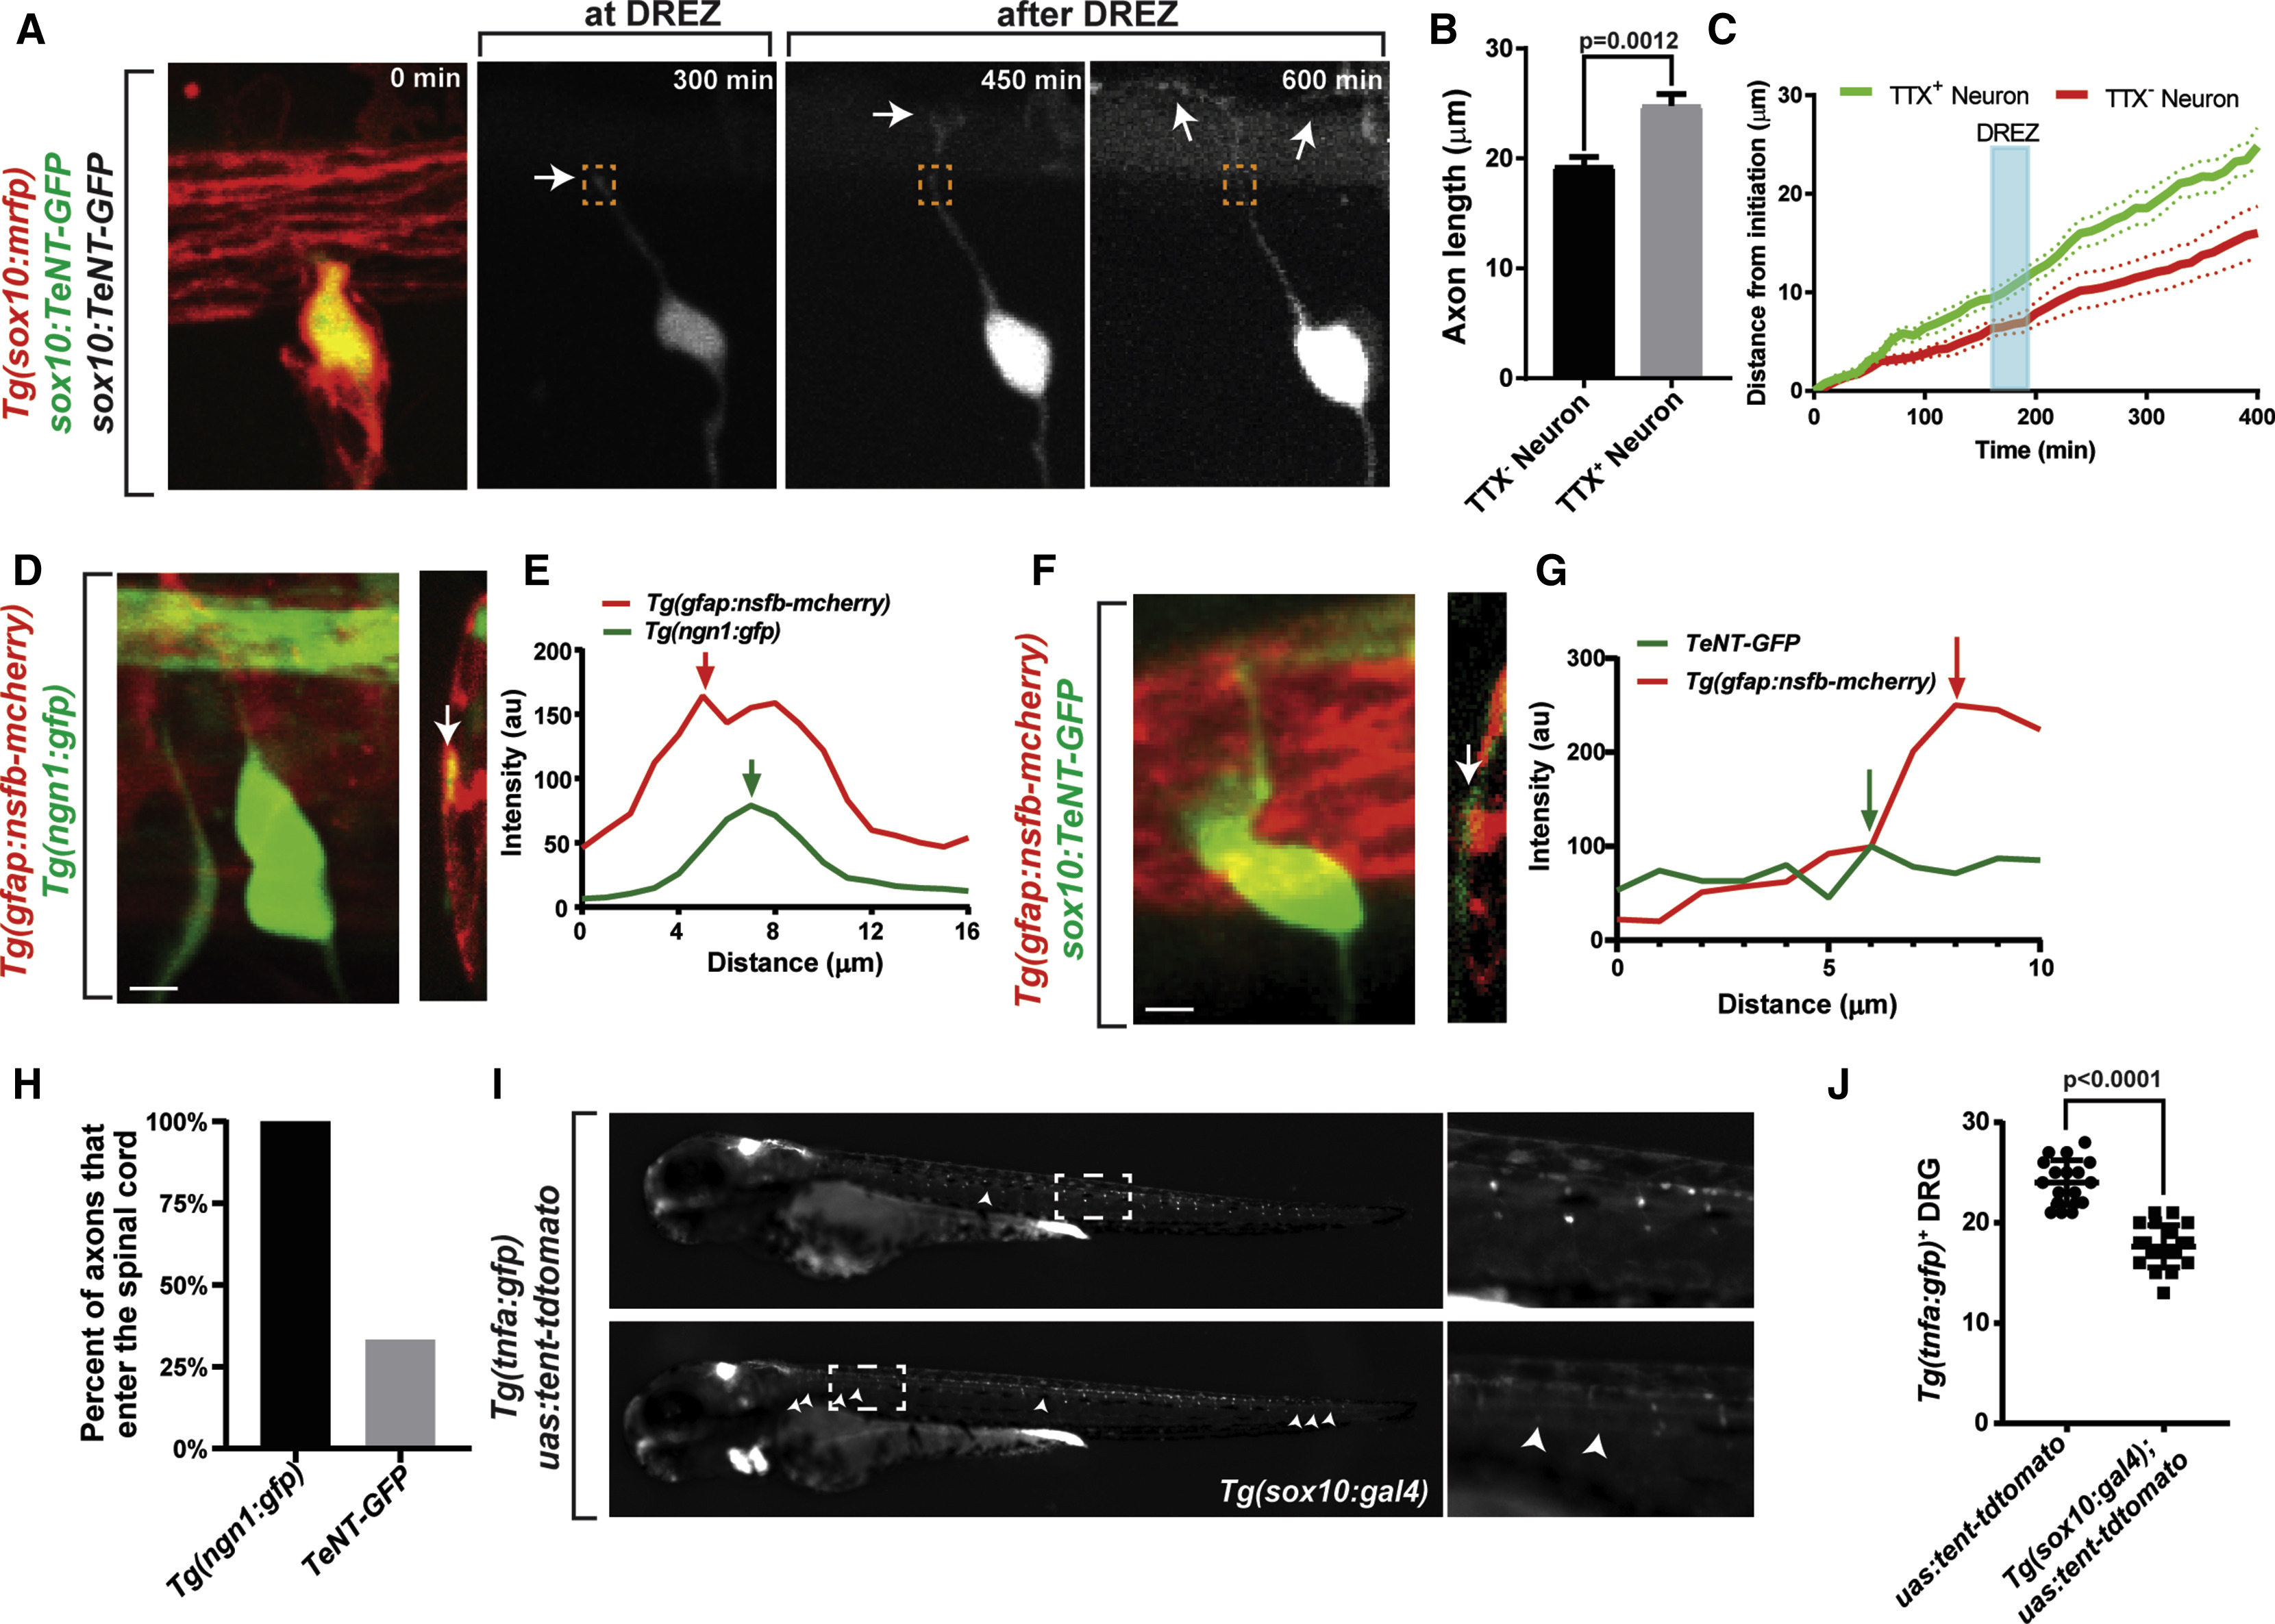
Inhibition of Vesicle Release Disrupts Pioneer Axon Targeting
(A) Confocal z-projections of pioneer axon navigation in a Tg(sox10:gal4); Tg(uas:mcherry); uas:TeNT-gfp animal from a 24-h time-lapse starting at 48 hpf. Inhibition of vesicle release results in pioneer axon mistargeting past DREZ. White arrows denote growth cones. Dashed orange box denotes DREZ.
(B) Axon length at 72 hpf of TENT− (n = 10) and TENT+ (n = 13) DRG.
(C) Growth cone tracings of axon navigation in TENT− (red; n = 10) and TENT+ (green; n = 13) DRG. Blue box denotes DREZ.
(D and F) Confocal z-projection and y-orthogonals of a Tg(ngn1:gfp); Tg(gfap:nsfb-mcherry) (D) and a Tg(gfap:nsfb-mcherry); uas:TeNT-gfp (F) animal. White arrows denote the location of the pioneer axon in relation to the glia limitans.
(E and G) Representative intensity tracings from y-orthogonals in (D) and (F) showing the relation of the pioneer axon and glia limitans for TeNT+ (E) and TeNT− (F). Red arrows denote glia limitans, and green arrows denote pioneer axon.
(H) Quantifications of DRG pioneer axon spinal cord entry at 72 hpf (n = 13 TENT−; n = 12 TENT+).
(I) Images of Tg(tnfa:gfp) (top) and Tg(tnfa:gfp); Tg(sox10:gal4) (bottom) animals injected with uas:tent-tdtomato plasmids. White arrowheads denote Tg(tnfa:gfp)− DRG. Dashed white boxes denote inset shown on right.
(J) Number of Tg(tnfa:gfp)+ DRG in uas:tent-tdtomato animals (n = 18) or in Tg(sox10:gal4); uas:tent-tdtomato animals (n = 20). SEM is shown.
Student’s t test was used for (B) and (J). Scale bars, 10 μm