
Fig. 7
- ID
- ZDB-FIG-191021-10
- Publication
- Nichols et al., 2019 - Synaptic-like Vesicles Facilitate Pioneer Axon Invasion
- Other Figures
- All Figure Page
- Back to All Figure Page
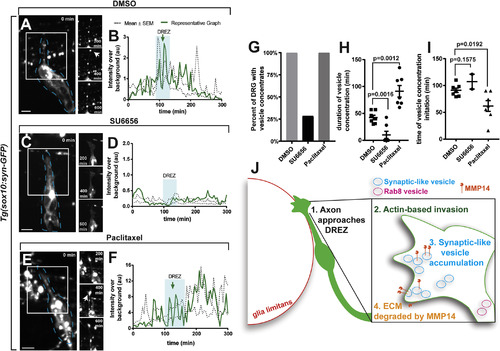
Modulation of Actin Structures Alters Vesicles at the DREZ (A, C, and E) Confocal z-projections of pioneer growth cone actin organization in Tg(sox10:syn-gfp) in animals treated with DMSO (A), SU6656 (C), and paclitaxel (E) from a 24-h time lapse starting at 48 hpf. White arrows denote actin concentrations at DREZ. White box denotes insets on right. Dashed blue lines denote DRG tracings. Note: fluorescence outside of white box in (E) is a spinal oligodendrocyte. (B, D, and F) Growth cone Syn-GFP intensity tracings throughout navigation in DMSO (B; n = 6), SU6656 (D; n = 7), and paclitaxel (F; n = 7) DRG. Inhibition of actin-based invasion abrogates Syn-GFP accumulation, and promotion of actin-based invasion generates robust Syn-GFP accumulation. Green line denotes representative graph. Dashed black line denotes mean ± SEM. Blue box denotes DREZ. (G) Percent of axons that demonstrate vesicle accumulations at DREZ (n = 6 DMSO; n = 7 SU6656; n = 7 paclitaxel). (H and I) Duration (H) and time of initiation (I) of vesicle concentrates at the DREZ showing changes in vesicles when actin invasion is altered (n = 6 DMSO; n = 7 SU6656; n = 7 paclitaxel). (J) Model of actin and synaptic-like vesicle coordinated invasion of the spinal cord by DRG pioneer axons. SEM is shown. Tukey’s HSD was used for (H) and (I). |
| Gene: | |
|---|---|
| Fish: | |
| Conditions: | |
| Anatomical Term: | |
| Stage Range: | Long-pec to Protruding-mouth |
| Fish: | |
|---|---|
| Condition: | |
| Observed In: | |
| Stage Range: | Long-pec to Protruding-mouth |