FIGURE SUMMARY
Title

Encapsulation of a TRPM8 Agonist, WS12, in Lipid Nanocapsules Potentiates PC3 Prostate Cancer Cell Migration Inhibition through Channel Activation

Authors
Grolez, G.P., Hammadi, M., Barras, A., Gordienko, D., Slomianny, C., Völkel, P., Angrand, P.O., Pinault, M., Guimaraes, C., Potier-Cartereau, M., Prevarskaya, N., Boukherroub, R., Gkika, D.
Source
Full text @ Sci. Rep.

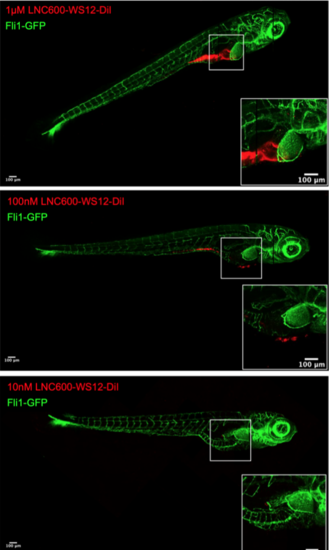
Confocal analysis of LNC600-WS12 uptake in zebrafish. LNC600-WS12 is labeled with DiI (red), and the results are shown for experiments performed in which 1 µM (A), 100 nM (B) or 10 nM (C) was used to treat zebrafish embryos for 6 days before the embryos were fixed. Confocal analysis showing the internalization of DiI-labeled LNC600-WS12 in the zebrafish. Zooms show the presence of LNC600-WS12 into the yolk sacs of zebrafish after treatment with 1µM and 100nM of LNC600-WS12.

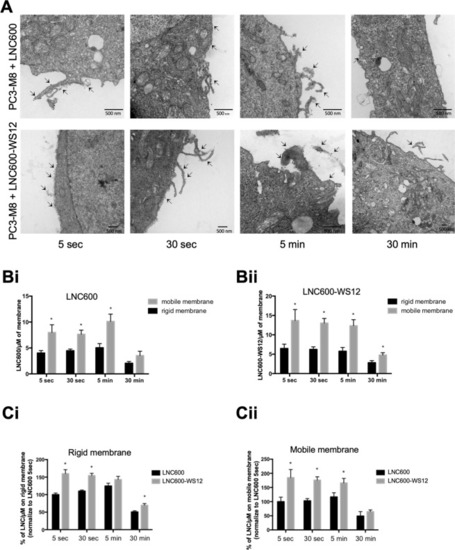
Plasma membrane penetration and dynamic localization of lipid nanocapsules. (A) Electron micrographs of PC3-M8 cells treated with 100 nM of empty LNC600 (upper panels) or 100 nM of LNC600-WS12 (lower panels) for different times (5 s, 30 s, 5 min and 30 min). Lipid Nanoparticles appeared as electron-dense spots located at the plasma membrane and are indicated by an arrow. (B) Bar graphs show the quantification of the data for empty LNC600 (Bi) or LNC600-WS12 (Bii) as µm of mobile or rigid plasma membrane at different timepoints after treatment with 100 nM of empty LNC600 or LNC600-WS12. (C) Bar plot showing the quantification of empty LNC600 or LNC600-WS12 in the rigid (Ci) and mobile (Cii) fractions of plasma membranes obtained from PC3-M8 cells at different timepoints after treatment with 100 nM of empty LNC600 or LNC600-WS12. *P < 0.05 (ANOVA, Tukey’s multiple comparisons test).

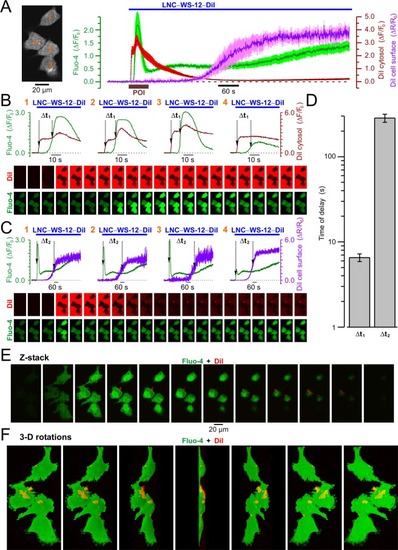
Confocal visualization of DiI/WS12-containing lipid nanocapsules (LNC600-WS12-DiI) and concurrent LNC-induced [Ca]i responses in PC3 cell expressing stably TRPM8. (A) Plot (right) compares the dynamics of relative changes in Fluo-4 fluorescence reporting WS12-induced changes in intracellular Ca2+ concentration, [Ca2+]i (ΔF/F0, green trace), DiI fluorescence reporting re-distribution of LNC content within the cell (ΔF/F0, red trace) and DiI fluorescence reporting aggregation of LNCs on the cell surface (ΔR/Ro, violet trace). The traces show mean ± S.E.M. signals from 4 cells (image, left). (B) Plots of Fluo-4 (green traces) and intracellular DiI (red traces) responses in 4 cells (numbered in A, left) during the period of interest (POI, brown bar in A, right) highlight the delay (Δt1) between internalization of LNC content and elevation of [Ca2+]i, respectively. (C) The same as B but the delay (Δt2) between the elevation of [Ca2+]i (green traces) and aggregation of LNCs on the cell surface (violet traces) is highlighted. The galleries below the plots show every 8th (B) and 100th (C) image captured during the periods corresponding to the plots. (D) Plot displays mean ± S.E.M. values of Δt1 and Δt2 measured in 40 cells upon 17 independent experiments. Note that the LNC is internalized before [Ca2+]i response initiation, while aggregation of LNCs on the cell surface became prominent >3 min later. (E,F) Visualization of the 3-dimensional (3-D) distributions of DiI and Fluo-4 fluorescence 20 min after stimulation of the cell with LNCs. The results are presented by galleries showing (E) every 2nd x-y image obtained during Z-sectioning protocol (Z-stack) and (F) rotations of the reconstructed 3-D image around Y axis with 30° step (3-D rotations). Note LNC aggregates (red) on the cell surface.

In vitro and in vivo effects of lipid nanocapsules on PC3-M8 cell viability and migration. (A) Cell viability assays performed with different TRPM8 agonists (WS12, empty LNC600, LNC600-WS12 or icilin) in PC3 and PC3-M8 cells and evaluated after 24 h (Ai) or 72 h (Aii) of incubation. MTS reagent was used to determine cell viability percentages (mean ± SEM; normalized to the control (CTRL) condition). (B) Transwell migration assays showing the effects of TRPM8 agonists on PC3 (Bi) or PC3-M8 (Bii) cells. The results are represented as a percentage of migrated cells normalized to the results observed under the CTRL condition (N = 9, mean ± SEM; *P < 0.05; **P < 0.01, ANOVA, Tukey’s multiple comparisons test for control and pairwise t-test comparison against 10 nM WS12 encapsulated or not condition, ##P < 0.01). (C) In vivo migration assays performed in zebrafish embryos. (Ci) Graph bar representing PC3 and PC3-M8 cell migration along the zebrafish tail following the application of 100 nM of empty LNC600, 100 nM of free WS12 or 100 nM of LNC600-WS12. For each condition, PC3 and PC3-M8 cells were counted and the results normalized to the total number of migrating cells (N = 15, mean ± SEM; *P < 0.05, ANOVA, Tukey’s multiple comparisons test). (Cii) Representative confocal images of Tg[Fli1-eGFP] zebrafish embryos (vasculature shown in green) injected with DiD-labeled PC3 (yellow) and DiI-labeled PC3-M8 (red) cells. Cell migration was quantified in two segments of the ventral part of the fish (1st and 2nd segments).

Acknowledgments
This image is the copyrighted work of the attributed author or publisher, and ZFIN has permission only to display this image to its users. Additional permissions should be obtained from the applicable author or publisher of the image. Full text @ Sci. Rep.