IMAGE

Figure 3

ID
ZDB-IMAGE-190723-54
Source
Figures for Grolez et al., 2019
Image
Figure Caption

Figure 3

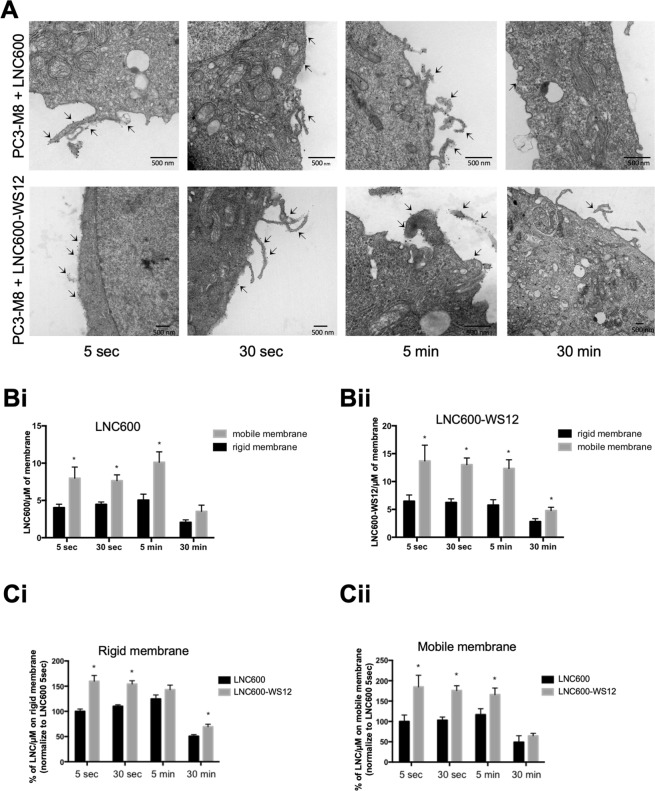
Plasma membrane penetration and dynamic localization of lipid nanocapsules. (A) Electron micrographs of PC3-M8 cells treated with 100 nM of empty LNC600 (upper panels) or 100 nM of LNC600-WS12 (lower panels) for different times (5 s, 30 s, 5 min and 30 min). Lipid Nanoparticles appeared as electron-dense spots located at the plasma membrane and are indicated by an arrow. (B) Bar graphs show the quantification of the data for empty LNC600 (Bi) or LNC600-WS12 (Bii) as µm of mobile or rigid plasma membrane at different timepoints after treatment with 100 nM of empty LNC600 or LNC600-WS12. (C) Bar plot showing the quantification of empty LNC600 or LNC600-WS12 in the rigid (Ci) and mobile (Cii) fractions of plasma membranes obtained from PC3-M8 cells at different timepoints after treatment with 100 nM of empty LNC600 or LNC600-WS12. *P < 0.05 (ANOVA, Tukey’s multiple comparisons test).

Acknowledgments
This image is the copyrighted work of the attributed author or publisher, and ZFIN has permission only to display this image to its users. Additional permissions should be obtained from the applicable author or publisher of the image. Full text @ Sci. Rep.