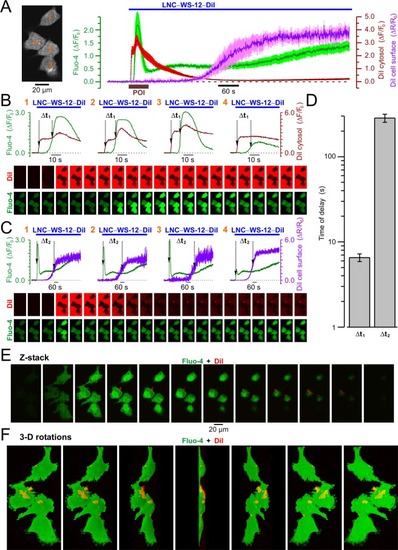
Confocal visualization of DiI/WS12-containing lipid nanocapsules (LNC600-WS12-DiI) and concurrent LNC-induced [Ca2±]i responses in PC3 cell expressing stably TRPM8. (A) Plot (right) compares the dynamics of relative changes in Fluo-4 fluorescence reporting WS12-induced changes in intracellular Ca2+ concentration, [Ca2+]i (ΔF/F0, green trace), DiI fluorescence reporting re-distribution of LNC content within the cell (ΔF/F0, red trace) and DiI fluorescence reporting aggregation of LNCs on the cell surface (ΔR/Ro, violet trace). The traces show mean ± S.E.M. signals from 4 cells (image, left). (B) Plots of Fluo-4 (green traces) and intracellular DiI (red traces) responses in 4 cells (numbered in A, left) during the period of interest (POI, brown bar in A, right) highlight the delay (Δt1) between internalization of LNC content and elevation of [Ca2+]i, respectively. (C) The same as B but the delay (Δt2) between the elevation of [Ca2+]i (green traces) and aggregation of LNCs on the cell surface (violet traces) is highlighted. The galleries below the plots show every 8th (B) and 100th (C) image captured during the periods corresponding to the plots. (D) Plot displays mean ± S.E.M. values of Δt1 and Δt2 measured in 40 cells upon 17 independent experiments. Note that the LNC is internalized before [Ca2+]i response initiation, while aggregation of LNCs on the cell surface became prominent >3 min later. (E,F) Visualization of the 3-dimensional (3-D) distributions of DiI and Fluo-4 fluorescence 20 min after stimulation of the cell with LNCs. The results are presented by galleries showing (E) every 2nd x-y image obtained during Z-sectioning protocol (Z-stack) and (F) rotations of the reconstructed 3-D image around Y axis with 30° step (3-D rotations). Note LNC aggregates (red) on the cell surface.
|
