FIGURE SUMMARY
Title

Glucocorticoids Target Ependymal Glia and Inhibit Repair of the Injured Spinal Cord

Authors
Nelson, C.M., Lennon, V.A., Lee, H., Krug, R.G., Kamalova, A., Madigan, N.N., Clark, K.J., Windebank, A.J., Henley, J.R.
Source
Full text @ Front Cell Dev Biol

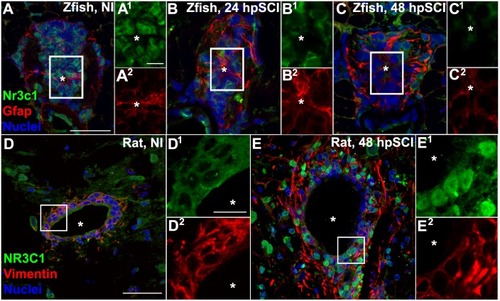
Spinal cord injury stimulates differential Nr3c1 expression by ependymal glia in zebrafish and rats. (A–C) Immunostaining for Nr3c1 (green) and Gfap (red), plus DAPI staining (blue) in larval zebrafish spinal cord transverse sections at 24 h after sham injury (A), or 24 h (B), and 48 h (C) post SCI. The nuclear Nr3c1 distribution in Gfap+-ependymal glia without injury (A1,2) is shifted to cytoplasmic at 24 and 48 h post SCI (B1,2,C1,2). Scale bars, 20 μm (A, same as B,C) and 5 μm (A1, same as A2–C2). Boxed regions denote ependymal glial cell bodies around the central canal () and are magnified 167% (A1,2–C1,2). Representative images from 10 zebrafish (three sections per cord examined). See Supplementary Figure S2 for validation of Nr3c1 immunoreactivity. (D,E) Adult rat spinal cord transverse sections examined at 48 h post sham injury (D) and 48 h post SCI within 300 μm rostral of transection (E). The cytoplasmic Nr3c1 expression in ependymal glia in controls (D1,2) is shifted to the nucleus after SCI (E1,2). Scale bars, 50 μm (D, same as E) and 12.5 μm (D1, same as D2–E2). Boxed regions denote ependymal glial cell bodies around the central canal and are magnified 333% (D1,2,E1,2). Representative images from six rat spinal cords (three sections per cord examined).

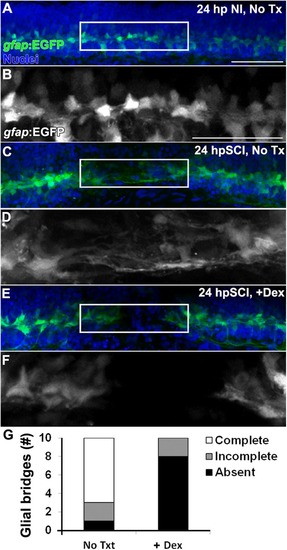
Glucocorticoids inhibit the formation of trans-lesion glial bridges. (A–F) Whole-mount preparations (lateral view) of Tg(gfap:EGFP) transgenic zebrafish show immunostaining for EGFP (green) and DAPI staining (blue) from 24 h post sham injury (A,B), 24 h post SCI with no treatment (C,D) and 24 h post SCI+Dex (E,F). EGFP-positive ependymal glia were observed spanning the lesion site at 24 h post SCI in controls (C,D), and were absent with Dex (E,F). Boxed regions (A,C,E) are magnified by 175% (B,D,F, respectively). Scale bars, 50 μm (A is the same as C,E; B is the same as D,F). Representative images from 10 preparations per condition. (G) Counts of glial bridges at 24 h post SCI in and 24 h post SCI+Dex.

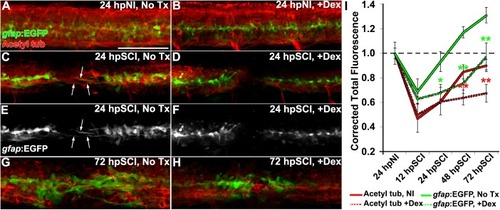
Glucocorticoids suppress glial bridges and axon regrowth. (A–H) Whole-mounted Tg(gfap:EGFP) zebrafish (lateral view) show spinal cord immunostaining for EGFP (green) and acetylated tubulin (axons, red) in uninjured controls (A,B), SCI followed by no treatment (C,E,G), and SCI with Dex treatment (D,F,H) for 24 and 72 h post SCI. Arrows indicate bipolar EGFP-positive glial bridges (C,E) and juxtaposed axons (C) that have entered the lesion at 24 h post SCI, but are absent with Dex treatments (D,F). Scale bar, 50 μm (A–H). (I) Quantification of the mean corrected total fluorescence intensity for axons (red lines) and ependymal glia (green lines) within 50 μm of the lesion center from no treatment controls (solid lines) and +Dex (dashed lines) relative to uninjured controls. Data show means ± SEM. p < 0.05; ∗∗p < 0.01 compared to SCI no treatment; n = 10 zebrafish per time point in each condition. and ∗∗ are color coded to match corresponding data points.

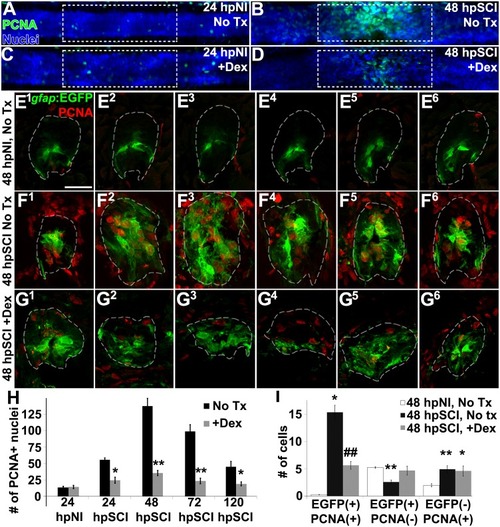
Glucocorticoids inhibit ependymal glial proliferation following SCI. (A–D) Whole-mounted larval zebrafish show immunostaining for PCNA (green) and DAPI staining (blue) in the spinal cord after sham injury (A,C) and 48 h post SCI (B,D), either followed by no treatment (A,B) or Dex treatment (C,D). Dashed boxes represent a 200-μm region centered at the lesion site used for quantifying cell counts and serve as scale bars (A is the same as B–D). (E–G) Spinal cord transverse sections in Tg(gfap:EGFP) zebrafish were immunostained to detect PCNA (red) and EGFP in six concurrent 16-μm thick cryosections that spanned the lesion site at 48 h post sham injury (E1–E6), 48 h post SCI followed by no treatment (F1–F6), and 48 h post SCI + Dex (G1–G6). Scale bar, 20 μm (E–G). Dashed outlines define the spinal cord area (as determined by DAPI staining [DAPI not shown to highlight colocalization]) used for quantifying cell counts. (H) Mean number of PCNA-positive cells ± SEM quantified from within a 100-μm region centered on the lesion (dashed boxes in A–D). p < 0.05; ∗∗p < 0.01; n = 10 zebrafish per time point in each condition. Comparisons were to the no treatment group for each time point. (I) Mean number of PCNA-positive and EGFP-positive cells ± SEM quantified within spinal cord (dashed outlines in E–G) cross sections in uninjured controls, SCI without treatment, and SCI + Dex. p < 0.05; ∗∗p < 0.01 compared to sham injury; #p < 0.05 and ##p < 0.01 compared to both sham and SCI control groups; n = 10 per time point in each condition.

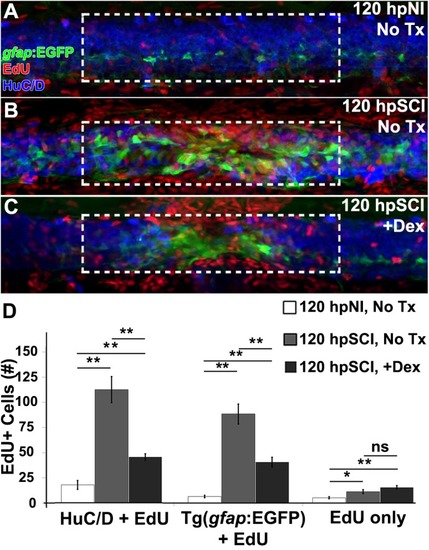
Glucocorticoids suppress neurogenesis. (A–C) Whole-mount preparations (lateral view) of Tg(gfap:EGFP) transgenic zebrafish show immunostaining for EGFP (green) and HuC/D (neurons, blue) along with detection of EdU (red) from 120 h post EdU incubation and sham injury (A), SCI followed by no treatment (B), and +Dex (C). Dashed boxes represent a 200-μm region centered at the lesion site used for quantifying cell counts and serve as scale bars (A is the same as B,C). (D) Quantification of the mean number of EdU-positive cells within the spinal cord (± SEM). p < 0.05; ∗∗p < 0.01; ns, not significant; 10 whole mounts per condition.

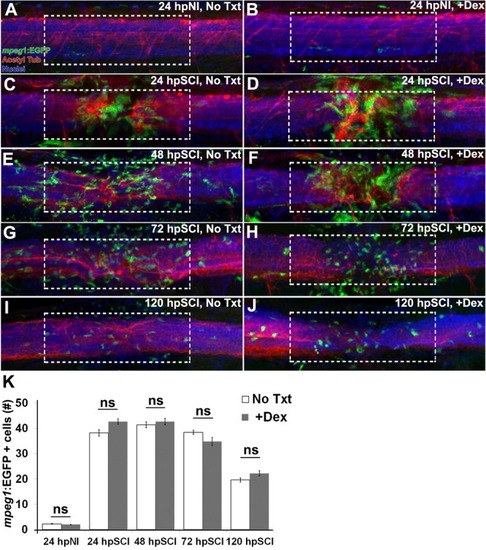
Responses of hematogenous cells and microglia to SCI and Dex treatments. (A–J) Whole-mount preparations (lateral view) of Tg(mpeg1:EGFP) transgenic zebrafish show immunostaining for EGFP (green) and acetylated tubulin (red), together with DAPI (blue) at 24 h post sham injury (A,B), 24 h (C,D), 48 h (E,F), 72 h (G,H), and 120 h (I,J) post SCI with no treatment (A,C,E,G,I), and +Dex (B,D,F,H,J). Dashed boxes represent a 200-μm region centered at the lesion site used for quantifying cell counts within the spinal cord domain and serve as scale bars (A is the same as B–J). (K) Quantification of the mean number of EGFP-positive cells within the spinal cord domain (± SEM). ns, not significant; 10 whole mounts per time point in each condition.

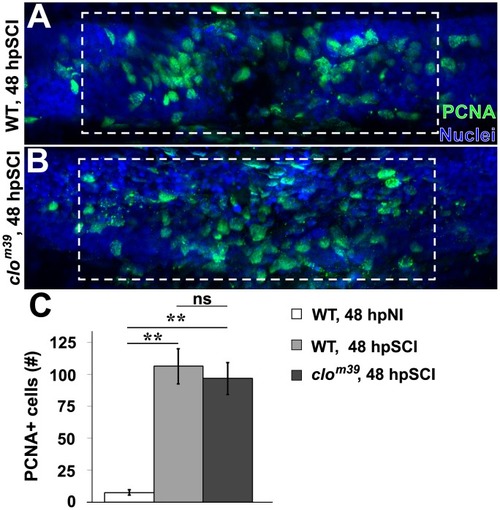
SCI-induced proliferation occurs without hematogenic or microglial responses. (A,B) Whole-mount preparations (lateral view) show spinal cords of wild-type (A) and cloche mutant (B) zebrafish immunostained for PCNA (green) at 48 h post SCI. Dashed boxes represent a 200-μm region centered at the lesion site used for quantifying cell counts and serve as scale bars (A is the same as B). (C) Quantification of PCNA-positive nuclei within the spinal cord domain (A,B). Data show the means ± SEM (∗∗p < 0.01; 10 zebrafish per group).

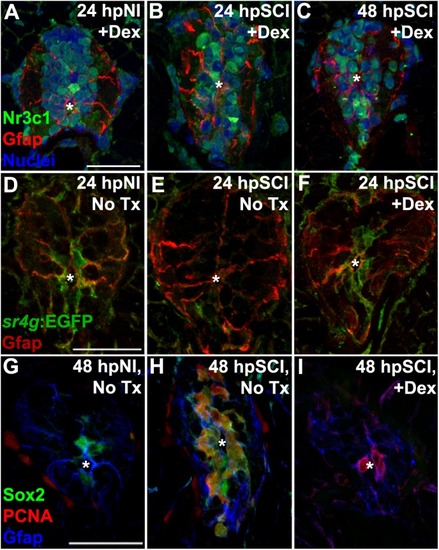
Direct effects of glucocorticoids in ependymal glia. (A–I) Zebrafish spinal cord transverse sections. (A–C) Immunostaining of wild-types for Nr3c1 (green) and Gfap (red), plus DAPI staining (blue) with Dex treatment at 24 h post sham injury (A), 24 h (B) and 48 h post SCI (C). Nuclear Nr3c1 (active) localization in Gfap-positive cells around the central canal is stimulated with Dex treatment. (D–F) Immunostaining for EGFP (pan-cytoplasmic) in the SR4G transgenic reporter line (green) and filamentous Gfap (red) at 24 h post sham injury (D) and SCI with no treatment (E) or 24 h post SCI +Dex (F). Nr3c1 signaling is constitutively active in ependymal glia in uninjured controls (D), diminished after SCI (E), and was maintained after SCI + Dex. (G–I) Immunostaining for Sox2 (green), PCNA (red) and Gfap (blue) from 48 h post sham injury (G), 48 h post SCI followed by no treatment (H), or 48 h post SCI +Dex (I). Sox2 immunoreactivity is reduced in ependymal glia and neural precursor cells after Dex treatment. Representative images from 10 spinal cords per time point in each condition. Scale bars, 20 μm (A is the same as B,C; D is the same as E,F; G is the same as H,I). denotes central canal.

Acknowledgments
This image is the copyrighted work of the attributed author or publisher, and ZFIN has permission only to display this image to its users. Additional permissions should be obtained from the applicable author or publisher of the image. Full text @ Front Cell Dev Biol