IMAGE

FIGURE 7

ID
ZDB-IMAGE-190723-847
Source
Figures for Nelson et al., 2019
Image
Figure Caption

FIGURE 7

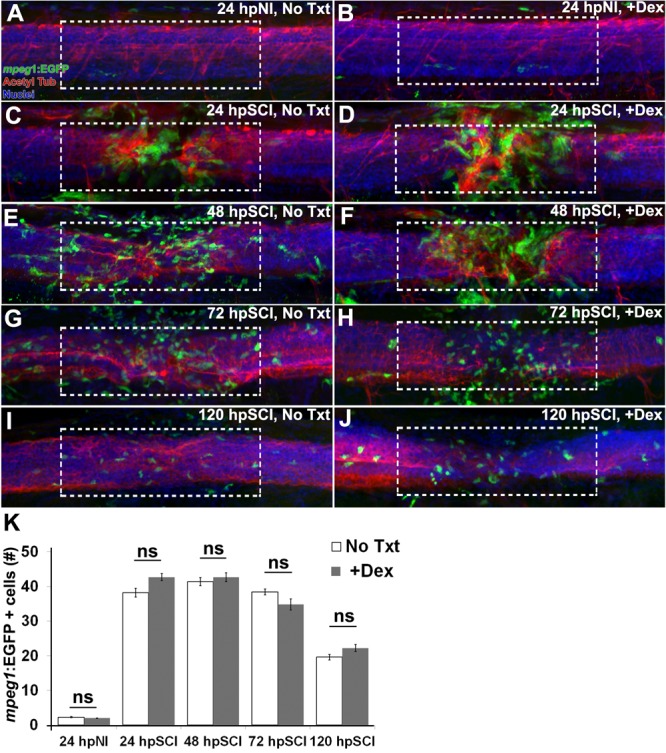
Responses of hematogenous cells and microglia to SCI and Dex treatments. (A–J) Whole-mount preparations (lateral view) of Tg(mpeg1:EGFP) transgenic zebrafish show immunostaining for EGFP (green) and acetylated tubulin (red), together with DAPI (blue) at 24 h post sham injury (A,B), 24 h (C,D), 48 h (E,F), 72 h (G,H), and 120 h (I,J) post SCI with no treatment (A,C,E,G,I), and +Dex (B,D,F,H,J). Dashed boxes represent a 200-μm region centered at the lesion site used for quantifying cell counts within the spinal cord domain and serve as scale bars (A is the same as B–J). (K) Quantification of the mean number of EGFP-positive cells within the spinal cord domain (± SEM). ns, not significant; 10 whole mounts per time point in each condition.

Acknowledgments
This image is the copyrighted work of the attributed author or publisher, and ZFIN has permission only to display this image to its users. Additional permissions should be obtained from the applicable author or publisher of the image. Full text @ Front Cell Dev Biol