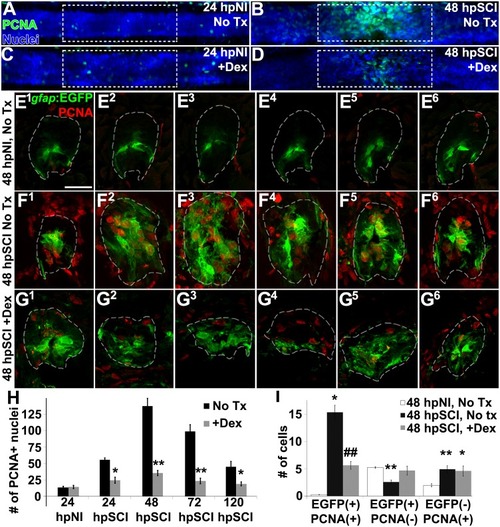
Glucocorticoids inhibit ependymal glial proliferation following SCI. (A–D) Whole-mounted larval zebrafish show immunostaining for PCNA (green) and DAPI staining (blue) in the spinal cord after sham injury (A,C) and 48 h post SCI (B,D), either followed by no treatment (A,B) or Dex treatment (C,D). Dashed boxes represent a 200-μm region centered at the lesion site used for quantifying cell counts and serve as scale bars (A is the same as B–D). (E–G) Spinal cord transverse sections in Tg(gfap:EGFP) zebrafish were immunostained to detect PCNA (red) and EGFP in six concurrent 16-μm thick cryosections that spanned the lesion site at 48 h post sham injury (E1–E6), 48 h post SCI followed by no treatment (F1–F6), and 48 h post SCI + Dex (G1–G6). Scale bar, 20 μm (E–G). Dashed outlines define the spinal cord area (as determined by DAPI staining [DAPI not shown to highlight colocalization]) used for quantifying cell counts. (H) Mean number of PCNA-positive cells ± SEM quantified from within a 100-μm region centered on the lesion (dashed boxes in A–D). ∗p < 0.05; ∗∗p < 0.01; n = 10 zebrafish per time point in each condition. Comparisons were to the no treatment group for each time point. (I) Mean number of PCNA-positive and EGFP-positive cells ± SEM quantified within spinal cord (dashed outlines in E–G) cross sections in uninjured controls, SCI without treatment, and SCI + Dex. ∗p < 0.05; ∗∗p < 0.01 compared to sham injury; #p < 0.05 and ##p < 0.01 compared to both sham and SCI control groups; n = 10 per time point in each condition.
|
