FIGURE SUMMARY
Title

Differential actinodin1 regulation in embryonic development and adult fin regeneration in Danio rerio

Authors
Phan, H.E., Northorp, M., Lalonde, R.L., Ngo, D., Akimenko, M.A.
Source
Full text @ PLoS One

Differential regulation of <italic>and1</italic> during larval development and adulthood.

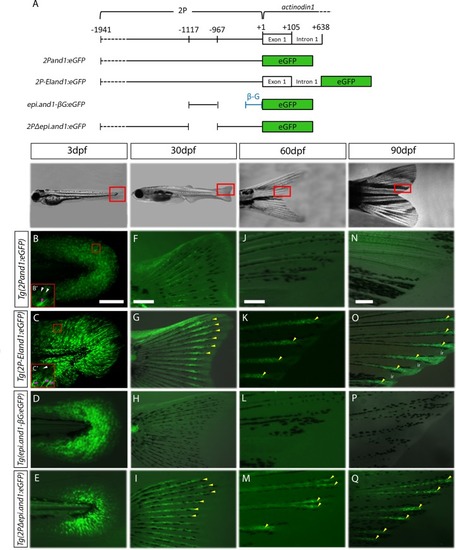
(A) Schematic representation of transgenic reporter constructs. GFP expression of four and1 reporter lines at 3dpf (B-E), 30dpf (F-I), 60dpf (J-M) and 90dpf (N-Q) showing fluorescent images merged onto bright field images. (B, B’, C, C’) confocal images (note: autofluorescence in the trunk tissue in C). Note: obtaining exactly the same plane of focus in the two transgenic lines is difficult; however, these images are simply to represent both transgenic lines have eGFP-positive ectodermal and mesenchymal cells. (B’, C’) 2x higher magnification on region boxed in red in panels B and C, respectively, showing the more elongated mesenchymal cells (pink arrowheads) in contrast to the hexagonally-shaped ectodermal cells (white arrowheads). (B, F, J, N) Tg(2Pand1:eGFP) (n = 5) expression in the ectoderm and fin ray mesenchyme fades after 30dpf. (C, G, K, O) Tg(2P-EIand1:eGFP) (n = 2) expression in the ectoderm and fin ray mesenchyme persists after 30dpf. (D, H, L, P) Tg(epi.and1-βG:eGFP) (n = 2) expression in the ectoderm is absent at 30dpf and onward; and (E, I, M, Q) Tg(2PΔepi.and1:eGFP) (n = 2) expression in the fin ray mesenchyme persists. Yellow arrowheads indicate fin ray-specific reporter expression. n = # of lines, ~25 fish/line. Scale bars = 200μm.

Reporter expression in the developing caudal fin of <italic>Tg(2P-EIand1</italic>:<italic>eGFP)</italic>.

(A) Reporter expression of Tg(2P-EIand1:eGFP) (25 fish were analysed) occurs within the ectodermal tissue and fin rays along the proximal-distal axis of the developing caudal fin. It is notably brighter as it approaches the distal region at 30dpf. (B) Reporter expression occurs along the proximal-distal axis in the fin rays and is beginning to approach the distal edge of the fin where ectodermal-specific expression is present at 40dpf. (C, D) At 50dpf and 60dpf, eGFP expression in the fin rays distalizes and is present in the epithelial tissue located at the very distal regions of the fin. (E, E’) Reporter expression only occurs at the distal tips of the fin rays and at the distal edge of the interrays (pink arrowheads). (E’) close-up on panel E. (F) Transverse sections from a 30dpf caudal fin were obtained in the region indicated by the yellow dotted line. (G) Immunostaining showing eGFP expression (white arrowheads) localized deep to the hemirays (h; delineated by yellow line) (n = 6). Immunostaining for Zns5, which is a pan-osteoblast marker, labelling osteoblasts surrounding the hemirays (h; yellow arrowheads) and eGFP (small white arrowheads) in Tg(2P-EIand1:eGFP) on transverse cryosections of 30dpf larvae (n = 6). (H) eGFP is localized in layers of cells deep and adjacent to osteoblast layers lining the hemirays (h). (H’) Merge on bright field. Double fluorescence in situ hybridization (n = 12) for and1 (I) and eGFP of Tg(2P-EIand1:eGFP) (I’). (I”) Merge between red and green showing colocalization between and1 and egfp (white arrowheads). (J) Merge with DAPI showing colocalization occurring within the fin ray mesenchymal tissues. Note: Any expression observed outside of the fin ray mesenchymal compartment is background staining. n = # of fish from which sections were obtained. Scale bars: A-E, E’ = 200μm, F = 100μm, G, H-H’ = 50μm and I-I”, J = 10μm.

<italic>Tg(2P-EIand1</italic>:<italic>eGFP)</italic> recapitulates <italic>and1</italic> expression throughout regeneration.

(A-F) In vivo time course analysis of eGFP reporter expression during fin regeneration in Tg(2P-EIand1:eGFP) (n = 12). (A-B) At 2dpa and 3dpa, reporter expression is brightly observed only in the interray tissue of Tg(2P-EIand1:eGFP). Yellow arrowheads indicate location of fin ray tissue. Yellow dotted line delineates amputation plane. (C-D) At 4dpa and 7dpa, fin ray-specific reporter expression occurs along the proximal-distal axis and is as equally bright as that of interray expression in Tg(2P-EIand1:eGFP). (E-F) Fin ray-specific reporter expression becomes distally restricted in Tg(2P-EIand1:eGFP). (G-K) Immunostaining for eGFP in Tg(2P-EIand1:eGFP) on consecutive transverse cryosections of 4dpa fin regenerate. (G) In the most distal region of the regenerate, reporter expression faintly occurs in the basal epithelial layer (pink arrowheads) surrounding the hemirays. The fin ray and interray are indicated by white brackets. (H-K) As sections progress proximally, reporter expression within the basal epithelial layer (pink arrowheads) is restricted towards the interray region. Reporter expression within the mesenchymal tissue is indicated by yellow arrowheads. (I-K) Reporter expression within basal epithelial layer is absent in middle regions of hemirays and overlaps with mesenchymal-specific expression in regions of hemirays that are closer to interrays (indicated by dotted yellow box in Panel K). Pink stars indicate autofluorescence from blood vessels. Double fluorescence in situ hybridization (n = 8) on longitudinal sections (proximal to the left and distal to the right hand sides of the panels) of 3dpa fin regenerate for (L) and1 and (L’) eGFP of Tg(2P-EIand1:eGFP). (L”) Merge with DAPI staining of cell nuclei. fr: fin ray, ir: interray, m: mesenchyme; bel: basal epithelial layer; e: epithelium. n = # of fish of which fins were sectioned and on which given experiment was performed. Scale bars: A = 100μm, B-F = 200μm, G-K = 50μm, L-L” = 50μm.

The <italic>epi3</italic> site within the <italic>epi</italic> region contains a mesenchymal-specific repressor that is active early in regeneration.

(A) Schematic representation of constructs. In vivo time course analysis of reporter expression in Tg(2Pand1:eGFP) (n = 7) (B, F, J, R), Tg(2P-EIand1:eGFP) (n = 12) (C, G, K, S), Tg(2PΔepi.and1:eGFP) (n = 11) (D, H, L, T), and Tg(2PΔepi3.and1:eGFP) (n = 13) (E, I, M, U) during fin regeneration. Fluorescent images are merged with bright field images. (N-Q) Immunostaining for eGFP on longitudinal cryosections of 4dpa fin regenerates. (B-E) At 2dpa, Tg(2Pand1:eGFP) and Tg(2P-EIand1:eGFP) only have interray epithelial-specific expression while Tg(2PΔepi.and1:eGFP), and Tg(2PΔepi3.and1:eGFP) have fin ray mesenchymal-specific expression. (F, G) At 3dpa, Tg(2Pand1:eGFP) and Tg(2P-EIand1:eGFP) have bright interray epithelial-specific expression and faint fin ray mesenchymal-specific expression. (H, I, L, M) In Tg(2PΔepi.and1:eGFP) and Tg(2PΔepi3.and1:eGFP), strong fin ray mesenchymal-specific expression is observed. (J, N, R) At 4dpa and 7dpa, fin ray mesenchymal- and basal epithelial-specific expression in Tg(2Pand1:eGFP) is faint and patchy. (K-M, O-Q, S-U) Reporter expression in Tg(2P-EIand1:eGFP) is bright in the interray, while fin ray mesenchymal-specific expression is just as bright as that of Tg(2PΔepi.and1:eGFP) and Tg(2PΔepi3.and1:eGFP). Time course analysis was done on one line for each construct; n = # of fish/ line. Pink stars in B and E indicate autofluorescence from white pigment cells and blood vessels. Yellow arrowheads indicate fin ray regenerative tissue. Amputation plane is delineated by yellow dotted line. Scale bars = 200μm.

<italic>EI</italic> contains an alternative promoter.

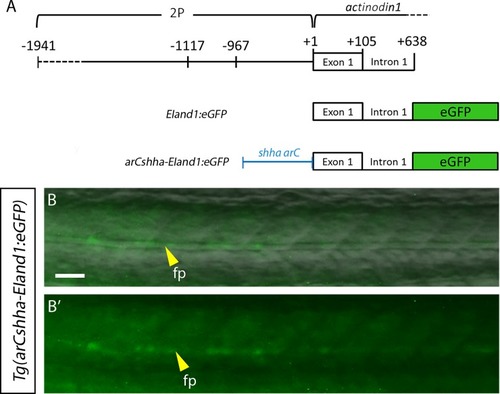
(A) Schematic representation of construct. (B-B’) 1dpf Tg(arCshha-EIand1:eGFP) F1 generation embryos showing eGFP expression in the floor plate cells (n = 15 fish, 1 line). (B) Merge with bright field image. (B’) Fluorescent image only. fp: floor plate. Scale bar: B-B’ = 25μm.

<italic>EI</italic> contains an adult tissuetranscriptional booster.

In vivo time course analysis of reporter expression of Tg((1117–1)EIand1:eGFP) (N = 3; n = 35) (B-D) and Tg(2PΔepi-EIand1:eGFP) (N = 3; n = 31) (E-G), at 3dpf (B, E), in intact fins at 90dpf (C, F), and at 4dpa (D, G) during fin regeneration. Note: adult fins are oriented in the proximal to distal direction (left to right). (B-D) Tg((1117–1)EIand1:eGFP) expression only occurs in the ectodermal/basal epithelial tissue; (E-G) Tg(2PΔepi-EIand1:eGFP), only mesenchymal tissue. fr: fin ray. N = number of lines found; n = total number of fish analysed. Scale bars: B, E = 25μm, C, F = 200μm and D, G = 200μm.

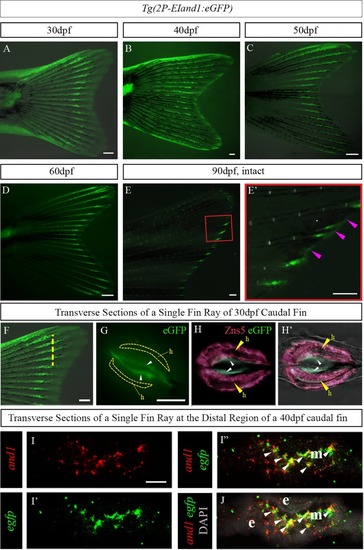
Tg(2P-EIand1:eGFP) recapitulates endogenous and1 expression in developing caudal fin at juvenile stage.

All experiments were performed on transverse cryosections of middle region (A-A’, B-B’, E, G) and distal region (C, D, F, H) of developing caudal fin of 40dpf juvenile fish. In situ hybridization (n = 8) for eGFP of Tg(2P-EIand1:eGFP) (A-A’, C, C’) and endogenous and1 expression (B-B’, D, D’). The fin rays and the interrays are indicated by brackets. (A’-D’) Higher magnification of a single fin ray from panels A-D, respectively. (E, F) Immunohistochemistry (n = 9) for And1/2. (E’, F’) merge with DAPI staining, which stains cell nuclei. n = # of fish of which fins were sectioned, and on which given experiment was performed. e: epithelium; fr: fin ray; ir: interray; m: mesenchyme. Melanocytes are the dark spots indicated by an asterisk. Scale bars: Panel A, B, C, D = 20μm, A’, B’, C’, D’ = 10μm, E-E’, F-F’ = 20μm.

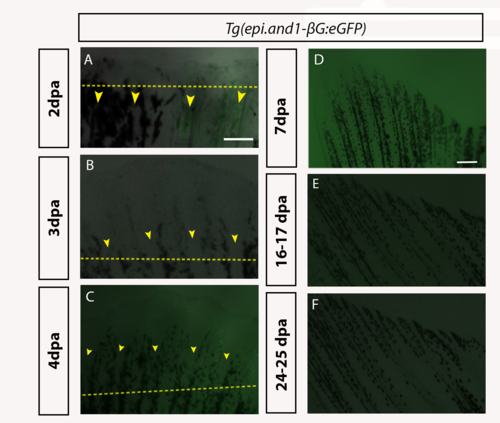
Time course analysis of eGFP in Tg(epi.and1-βG:eGFP) throughout regeneration.

Regenerative time course analysis of in vivo reporter expression of Tg(epi.and1-βG:eGFP) (n = 25 fish/line, 2 lines) at 2dpa (A), 3dpa (B), 4dpa (C), 7dpa (D), 16-17dpa (E) and 24-25dpa (F). (A-F) There is a complete absence of reporter expression throughout regeneration. All scale bars = 200μm.

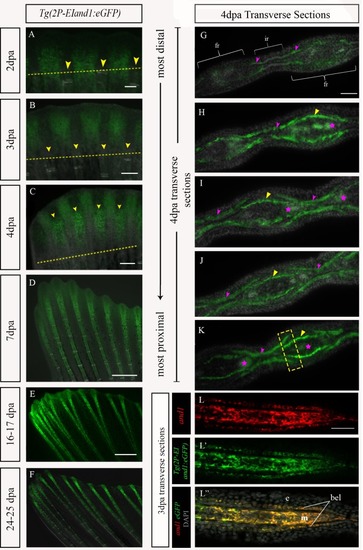
Time course analysis of Tg((1117–1)EIand1:eGFP) and Tg(2P-EIand1:eGFP)throughout regeneration.

In vivo time course analysis of reporter expression of Tg(2P-EIand1:eGFP) (n = 12) (A-F) and Tg((1117–1)EIand1:eGFP) (n = 5) (n = 25 fish/line, 2 lines) (G-L) during fin regeneration. (A-B, G-H) At 2dpa and 3dpa, reporter expression is brightly observed only in interray tissue of Tg(2P-EIand1:eGFP) and Tg((1117–1)EIand1:eGFP). (C-D) At 4dpa and 7dpa, fin ray mesenchymal-specific reporter expression occurs along the proximal-distal axis and is as equally bright as that of interray-specific expression in Tg(2P-EIand1:eGFP), which occurs at the distal region of the regenerate. (E-F) Fin ray-specific reporter expression begins to distally restrict in Tg(2P-EIand1:eGFP). (I-J) Reporter expression only occurs in interray of Tg((1117–1)EIand1:eGFP) and always remains confined within the distal region of regenerate. (K-L) reporter expression occurs in the interray and distal edge of the fin in Tg((1117–1)EIand1:eGFP). Scale bar: A, G = 100μm, B, H = 200μm, C, I = 200μm, D, J = 200μm, E-F, K-L = 200μm. (Images in panels A-F have been reused from Fig 3.4. for better comparison of eGFP expression.)

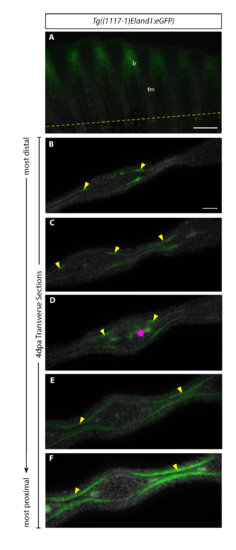
Transverse sections of 4dpa of Tg(1117–1+EIeGFP).

Reporter expression of (A) Tg((1117–1)EIand1:eGFP) (n = 2) in vivo at 4dpa. Immunostaining for eGFP in Tg((1117–1)EIand1:eGFP) on consecutive transverse cryosections (B-F). (B) In the most distal region of regenerate, reporter expression occurs in the basal epithelial layer distal to the hemirays. As sections progress proximally, (C-F) reporter expression within basal epithelial layer restricts towards interray region. (E, F) Reporter expression occurs within basal epithelial layer of the interray and the fin ray region closer to the interray (indicated by dotted yellow box). It is absent in middle regions of hemirays. Basal epithelial layer-specific expression is indicated by yellow arrows. Pink star indicates autofluorescence from blood vessels. Scale bars: A = 200μm, B-F = 50μm. n = # of fish from which sections were obtained.

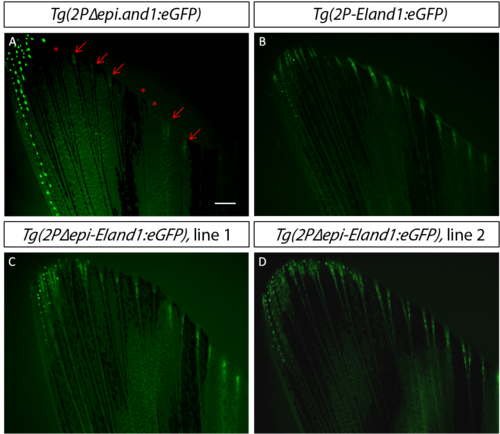
The EI region is necessary to enhance fin ray mesenchymal-specific expression even without the epi repressor.

(A) Distal fin ray mesenchymal-specific expression does not occur in all fin rays. Reporter expression is bright and consistent in all fin rays in Tg(2P-EIand1:eGFP) (B), and in two different Tg(2PΔepi-EIand1:eGFP) lines (C, D). Red arrows indicate presence of fin ray-specific expression while asterisk indicates absence of expression. Scale bar = 200μm.

Acknowledgments
This image is the copyrighted work of the attributed author or publisher, and ZFIN has permission only to display this image to its users. Additional permissions should be obtained from the applicable author or publisher of the image. Full text @ PLoS One