
- Title
-
Zebrafish Klf4 maintains the ionocyte progenitor population by regulating epidermal stem cell proliferation and lateral inhibition
- Authors
- Chen, Y.C., Liao, B.K., Lu, Y.F., Liu, Y.H., Hsieh, F.C., Hwang, P.P., Hwang, S.L.
- Source
- Full text @ PLoS Genet.
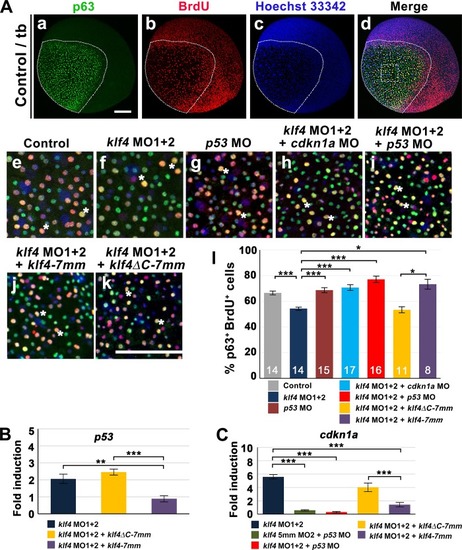
( EXPRESSION / LABELING:
|
|
( EXPRESSION / LABELING:
PHENOTYPE:
|
( |
|
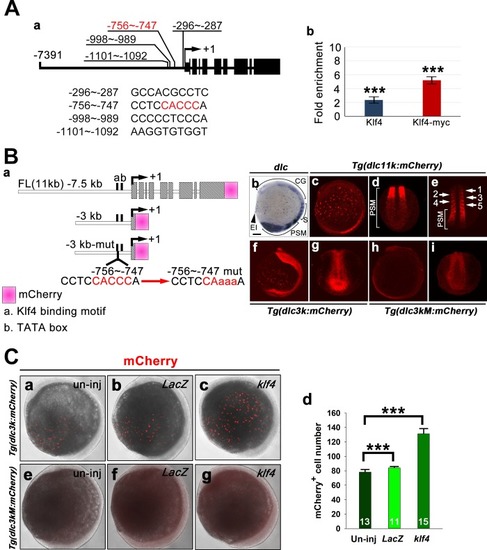
( EXPRESSION / LABELING:
|
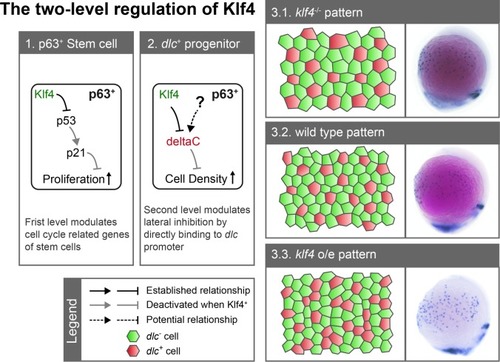
Zebrafish Klf4 exerts two-level regulatory activity toward the development of ionocytes. In wild-type embryos, Klf4 represses |

ZFIN is incorporating published figure images and captions as part of an ongoing project. Figures from some publications have not yet been curated, or are not available for display because of copyright restrictions. |
|
ZFIN is incorporating published figure images and captions as part of an ongoing project. Figures from some publications have not yet been curated, or are not available for display because of copyright restrictions. |
|
ZFIN is incorporating published figure images and captions as part of an ongoing project. Figures from some publications have not yet been curated, or are not available for display because of copyright restrictions. |
|
ZFIN is incorporating published figure images and captions as part of an ongoing project. Figures from some publications have not yet been curated, or are not available for display because of copyright restrictions. |
|
ZFIN is incorporating published figure images and captions as part of an ongoing project. Figures from some publications have not yet been curated, or are not available for display because of copyright restrictions. PHENOTYPE:
|
|
ZFIN is incorporating published figure images and captions as part of an ongoing project. Figures from some publications have not yet been curated, or are not available for display because of copyright restrictions. |
|
ZFIN is incorporating published figure images and captions as part of an ongoing project. Figures from some publications have not yet been curated, or are not available for display because of copyright restrictions. |
|
ZFIN is incorporating published figure images and captions as part of an ongoing project. Figures from some publications have not yet been curated, or are not available for display because of copyright restrictions. |
|
ZFIN is incorporating published figure images and captions as part of an ongoing project. Figures from some publications have not yet been curated, or are not available for display because of copyright restrictions. |