
- Title
-
Live Tracking of Inter-organ Communication by Endogenous Exosomes In Vivo
- Authors
- Verweij, F.J., Revenu, C., Arras, G., Dingli, F., Loew, D., Pegtel, M.D., Follain, G., Allio, G., Goetz, J.G., Zimmermann, P., Herbomel, P., Del Bene, F., Raposo, G., van Niel, G.
- Source
- Full text @ Dev. Cell
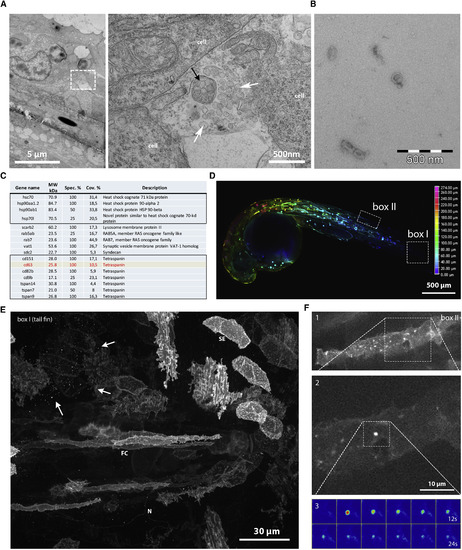
Identification and In Vivo Visualization of EVs in Zebrafish (A) Electron microscopic analysis of a 3 dpf zebrafish embryo showing heterogeneous EVs between basal epidermal cells. White arrows indicate exosome-like vesicles, and black arrow indicates an enwrapped cluster of vesicles. (B) Electron microscopy observation of EVs purified by ultra-centrifugation from the supernatant of AB.9 caudal fibroblastcells. (C) Mass spectrometry analysis of AB.9-derived EVs (excerpt, complete list in Table S1). (D) Transient mosaic expression of ubi:CD63-pHluorin in 35 hpf zebrafish embryo, pseudo-colored for depth. (E) Example of cell types in caudal fin targeted by transient mosaic expression of CD63-pHluorin (3 dpf). Identified as, among others, skin epithelial (SE), neuronal (N), and fibroblast cells (FC). Arrows point at labeled EV. (F) Example of a fusion event observed in a fibroblast-like cell (1), with zoom in (2), and time-lapse heatmap of the event (3). |
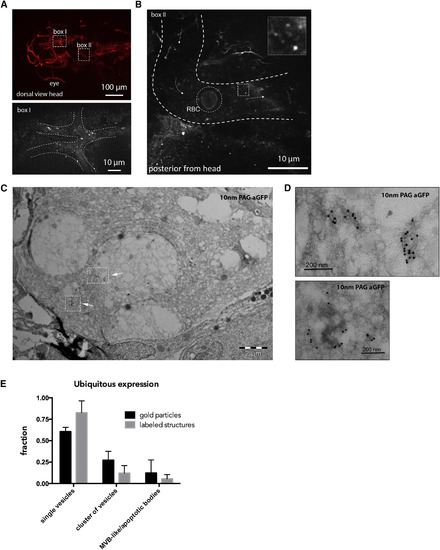
EVs Travel through the Blood Flow (A) Dorsal view of the vasculature in the head of a Tg(kdrl:Hsa.HRAS-mCherry) 3 dpf zebrafish larva expressing CD63-pHluorin after injection of ubi:CD63-pHluorin pDNA at the 1-cell stage. Boxes I and II indicate areas of interest imaged for CD63-pHluorin, shown in (A) (lower panel) and (B). (B) Still of time-lapse sequence shown in Video S1A, indicating the approximate vasculature wall (dashed white lines), a red blood cell (RBC), and in the dotted box, a sample of EVs seen in the bloodstream, which is magnified in the insert. Arrows indicate the direction of the blood flow. (C and D) IEM on the vasculature of ubi:CD63-pHluorin pDNA-injected fish (transient mosaic expression), labeled with gold particles directed to GFP (10 nm), showing (D) single vesicle (upper panel) and clusters (lower panel) of vesicles, corresponding to the dotted boxes in (C). (E) Quantification of vesicle labeling and appearance (single/clustered) of EVs as in (C) (mean ± SD, >25 different fields, n = 2). |
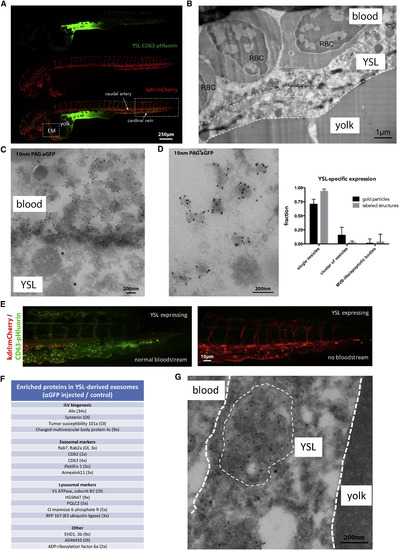
Origin and Composition of Exosomes in the Blood Flow (A, B, D, and E) Fluorescence image of a 3 dpf Tg(kdrl:Hsa.HRAS-mCherry) embryo injected with ubi:CD63-pHluorin in the YSL, green channel (top), red channel (middle), and merge (bottom). Box [EM] indicates the approximate region for EM analysis, shown in (B) and (D). Box to the right indicates the area shown in (E). (B) IEM image of the YSL of a 3 dpf Tg(kdrl:Hsa.HRAS-mCherry) embryo injected with ubi:CD63-pHluorin in the YSL labeled with gold particles directed to GFP (10 nm). Dashed white lines indicate the approximate membranes of the YSL. Dashed line box indicates area shown enlarged in (C). RBC, red blood cell. (C) Zoom in of area indicated in (B), showing MVE (asterisk) in the YSL, and EVs labeled for gold particles directed to GFP (10 nm) on top of the YSL. (D) (Left panel) IEM image of exosome-sized EVs observed in blood vessel lumen, labeled with gold particles directed to GFP (10 nm). Graph on the right: quantification of vesicle labeling and appearance as in Figure 2E (mean ± SD, >25 different fields, n = 2). (E) Zoom in on area indicated with rectangular box on the right in (A). (Left panel) Fish with blood flow; (Right panel) fish without blood flow, both expressing CD63-pHluorin in the YSL. (F) Mass-spectrometry analysis of enriched proteins in YSL-derived EVs (excerpt, complete list in Table S2) (numbers between bracket indicated the rate of enrichment in injected embryos compared to control embryos; OI, only detected in injected embryos). (G) IEM image of an MVE in the YSL area, labeled with gold particles directed to GFP (10 nm). Thin dashed white circle indicates an MVE. YSL, yolk syncytial layer; MVE, multivesicular endosome. |
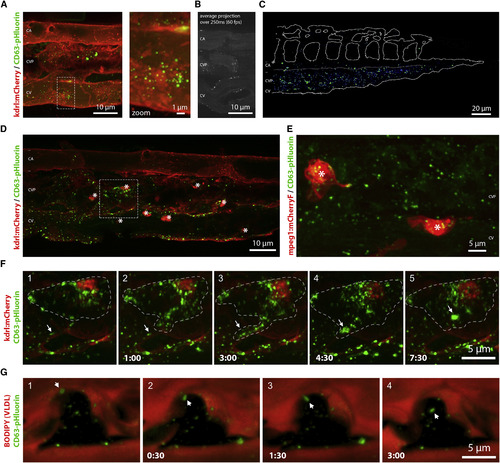
Distribution and Target Cells of YSL Exosomes (A) Still of time-lapse shown in Video S3A of the CVP of a 3 dpf Tg(kdrl:Hsa.HRAS-mCherry) embryo expressing CD63-pHluorin in the YSL. Dashed box indicates area shown at higher magnification to the right. (B) Average projection of 15 sequential frames of Video S3B, showing caudal artery (CA), CVP, and the cardinal vein (CV) in 3 dpf zebrafish embryos expressing CD63-pHluorin in the YSL. (C) Heatmap of CD63-pHluorin signal in CVP of 6 3 dpf Tg(kdrl:Hsa.HRAS-mCherry) zebrafish embryos expressing CD63-pHluorin in the YSL. (D) CVP of a 3 dpf Tg(kdrl:Hsa.HRAS-mCherry) embryo expressing CD63-pHluorin in the YSL. Stars indicate macrophages. Dashed box indicates area shown in Video S4B and (F). Asterisks indicate macrophages. (E) Still of Video S4A, showing the CVP of a 3 dpf Tg(mpeg1:mCherryF) expressing CD63-pHluorin in the YSL. Asterisks indicate macrophages. (F) Time-lapse of a macrophage in a 3 dpf Tg(kdrl:Hsa.HRAS-mCherry) zebrafish embryo expressing CD63-pHluorin in the YSL, shown in Video S4B. (G) Time-lapse of macrophage in a BODIPY-C12 injected 3 dpf zebrafish embryo expressing CD63-pHluorin in the YSL, shown in Video S4C. CA, caudal artery; YSL, yolk syncytial layer; CVP, caudal vein plexus. |
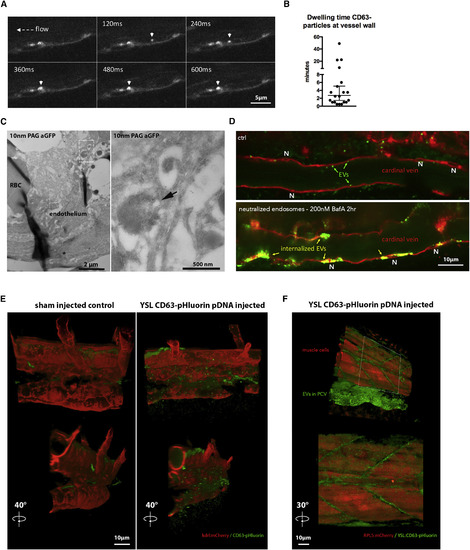
Interaction of YSL-Exosomes with Endothelium and Presence of YSL-Exosomes in ISF (A) Time-lapse of Video S5A, showing the rolling and arrest of exosomes in the cardinal vein of 3 dpf zebrafish embryo expressing CD63-pHluorin in the YSL. (B) Quantification of dwelling time of CD63-pHluorin exosomes at the vascular wall (mean ± SD, n = 20 events). (C) EM image of the CVP of a 3 dpf zebrafish embryo expressing CD63-pHluorin in the YSL, labeled with gold particles directed to GFP (10 nm). Insert indicates area shown at higher magnification to the right. Arrow indicates internalized CD63-pHluorin exosomes in endo-lysosomal compartment of endothelial cell. (D) Close up of the cardinal vein of 3 dpf Tg(kdrl:Hsa.HRAS-mCherry) zebrafish embryos expressing CD63-pHluorin in the YSL, control-treated (DMSO), or treated with bafilomcinA (BafA) to neutralize acidic compartments. (E) CVP area of 3 dpf Tg(kdrl:Hsa.HRAS-mCherry) zebrafish embryos sham-injected or injected with CD63-pHluorin pDNA in the YSL. (F) Mid-trunk segment of 3 dpf zebrafish embryos expressing CD63-pHluorin in the YSL and mCherry under the ubiquitous RPL5 promoter. At this exposure level in the red channel, mostly muscle cells are visible. YSL, yolk syncytial layer; CVP, caudal vein plexus; PCV, posterior cardinal vein. |
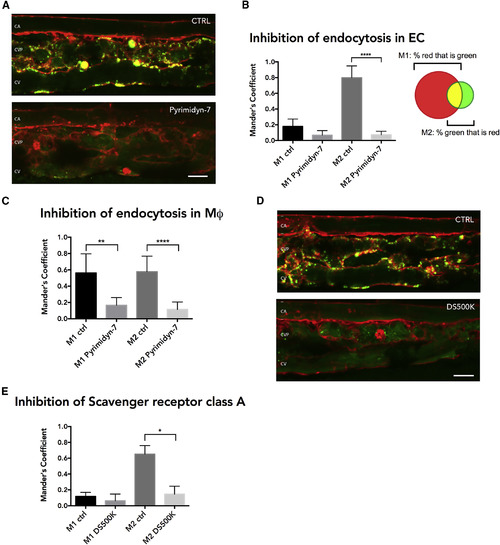
Characterization of Uptake Mechanism YSL-Exosomes by Endothelial Cells (A) Close up of the CVP area of 3 dpf Tg(kdrl:Hsa.HRAS-mCherry) zebrafish embryos expressing CD63-pHluorin in the YSL, treated with BafA to show internalized EVs and co-treated with DMSO (CTRL) or dynamin-inhibitor Pyrimidyn-7 (Pyrimidin-7). (B) Quantification of experiments as performed in (A), showing the overlap coefficient of red with green (M1) and green with red (M2) signal (mean ± SD, ∗∗∗∗p ≤ 0.0001; n ≥ 3; unpaired t test with equal SD). (C) As in (B), but for macrophages alone (mean ± SD, ∗∗∗∗p ≤ 0.0001; 7 macrophages per condition, n ≥ 3; unpaired t test with equal SD). (D) Close up of the CVP area of 3 dpf Tg(kdrl:Hsa.HRAS-mCherry) zebrafish embryos expressing CD63-pHluorin in the YSL treated with BafA to show internalized exosomes and non-injected or injected with 500K Dextran Sulfate (DS500K). (E) Quantification of experiments as performed in (D) (mean ± SD, ∗p ≤ 0.05; n ≥ 2; unpaired t test with equal SD). YSL, yolk syncytial layer; BafA, bafilomycin A; CVP, caudal vein plexus. Scale bars represent 10 μm. |
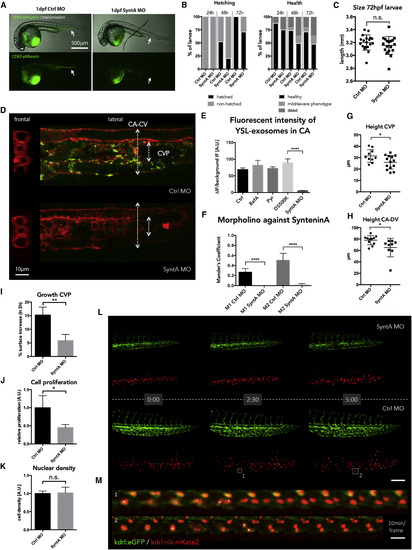
Functional Analysis of YSL-Exosomes (A) Transmission and fluorescent images of Ctrl MO- or SyntA MO-treated 1 dpf zebrafish embryos. (B) Quantification of morphological features of Ctrl MO- or SyntA MO-treated 1–3 dpf (24–72 h) zebrafish embryos. To the left, hatched versus non-hatched comparison. To the right, health status comparison with normal morphology (healthy), mild or severe developmental defects, and mortality. Sample size ≥ 120. (C) Size (length) of Ctrl MO- or SyntA MO-treated 3 dpf zebrafish embryos (scatter-dot plot, mean ± SD; n = 19, n = 18, respectively). (D) Close up of the CVP area of 3 dpf Tg(kdrl:Hsa.HRAS-mCherry) zebrafish embryos expressing CD63-pHluorin in the YSL, co-injected with Ctrl MO or SyntA MO in the YSL. Left panel: frontal view; right panel: lateral view. CA, caudal artery; CV, cardinal vein. (E) Fluorescent intensity of GFP signal in CA measured during different treatments. BafA, bafilomycin-A; Pyr, Pyrimidyn-7; DS500K, 500 KDa dextran sulfate; SyntA MO, syntenin-a morpholino; A.U., arbitrary units. mean ± SD; ∗∗∗∗p ≤ 0.0001; all conditions show at least triplicates of n ≥ 3; unpaired t test with equal SD. (F) Quantification of overlap-coefficient of red with green (M1) and green with red (M2) in Ctrl MO- or SyntA MO-treated 3 dpf Tg(kdrl:Hsa.HRAS-mCherry) zebrafish embryos, as shown in (D) (mean ± SD; ∗∗∗∗p ≤ 0.0001; n = 5; unpaired t test with equal SD). (G and H) Quantification of height of caudal part of vasculature, specifically for the CVP at second intersegmental vessel (ISV), or (H) measured from CA to CV (scatter-dot plot, mean ± SD; ∗p ≤ 0.05; n ≥ 10, n ≥ 9 resp; unpaired t test with equal SD). (I–K) Tg(kdrl:eGFP /nls-mKate2) embryos injected with control (Ctrl MO) or syntenin-a (SyntA MO) morpholinos in the YSL, analyzed for growth (I), proliferation (J), and nuclear density (K) in the CVP between 35 and 40 hpf (mean ± SD; ∗p ≤ 0.05; ∗∗p ≤ 0.01; n = 4; unpaired t test with equal SD). (L) Time-lapse of Tg(kdrl:eGFP /nls-mKate2) embryos between 35 and 40 hpf. Boxes indicate 2 examples of proliferating cells. as shown in (M). Scale bar represents 40 μm. (M) Two examples of dividing cells are shown. Scale bar represents 15 μm. YSL, yolk syncytial layer; CVP, caudal vein plexus. |
Reprinted from Developmental Cell, 48(4), Verweij, F.J., Revenu, C., Arras, G., Dingli, F., Loew, D., Pegtel, M.D., Follain, G., Allio, G., Goetz, J.G., Zimmermann, P., Herbomel, P., Del Bene, F., Raposo, G., van Niel, G., Live Tracking of Inter-organ Communication by Endogenous Exosomes In Vivo, 573-589.e4, Copyright (2019) with permission from Elsevier. Full text @ Dev. Cell