
Fig. 2
- ID
- ZDB-FIG-190626-2
- Publication
- Verweij et al., 2019 - Live Tracking of Inter-organ Communication by Endogenous Exosomes In Vivo
- Other Figures
- All Figure Page
- Back to All Figure Page
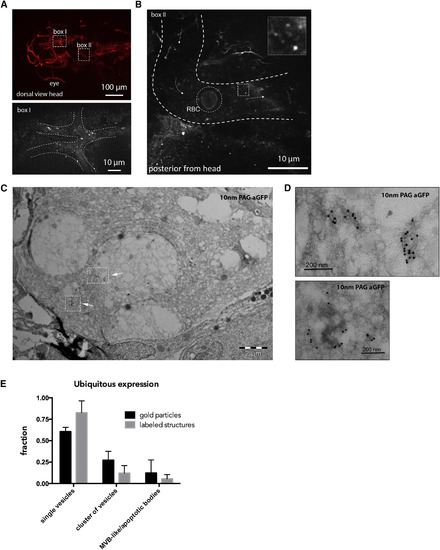
EVs Travel through the Blood Flow (A) Dorsal view of the vasculature in the head of a Tg(kdrl:Hsa.HRAS-mCherry) 3 dpf zebrafish larva expressing CD63-pHluorin after injection of ubi:CD63-pHluorin pDNA at the 1-cell stage. Boxes I and II indicate areas of interest imaged for CD63-pHluorin, shown in (A) (lower panel) and (B). (B) Still of time-lapse sequence shown in Video S1A, indicating the approximate vasculature wall (dashed white lines), a red blood cell (RBC), and in the dotted box, a sample of EVs seen in the bloodstream, which is magnified in the insert. Arrows indicate the direction of the blood flow. (C and D) IEM on the vasculature of ubi:CD63-pHluorin pDNA-injected fish (transient mosaic expression), labeled with gold particles directed to GFP (10 nm), showing (D) single vesicle (upper panel) and clusters (lower panel) of vesicles, corresponding to the dotted boxes in (C). (E) Quantification of vesicle labeling and appearance (single/clustered) of EVs as in (C) (mean ± SD, >25 different fields, n = 2). |
Reprinted from Developmental Cell, 48(4), Verweij, F.J., Revenu, C., Arras, G., Dingli, F., Loew, D., Pegtel, M.D., Follain, G., Allio, G., Goetz, J.G., Zimmermann, P., Herbomel, P., Del Bene, F., Raposo, G., van Niel, G., Live Tracking of Inter-organ Communication by Endogenous Exosomes In Vivo, 573-589.e4, Copyright (2019) with permission from Elsevier. Full text @ Dev. Cell