
|
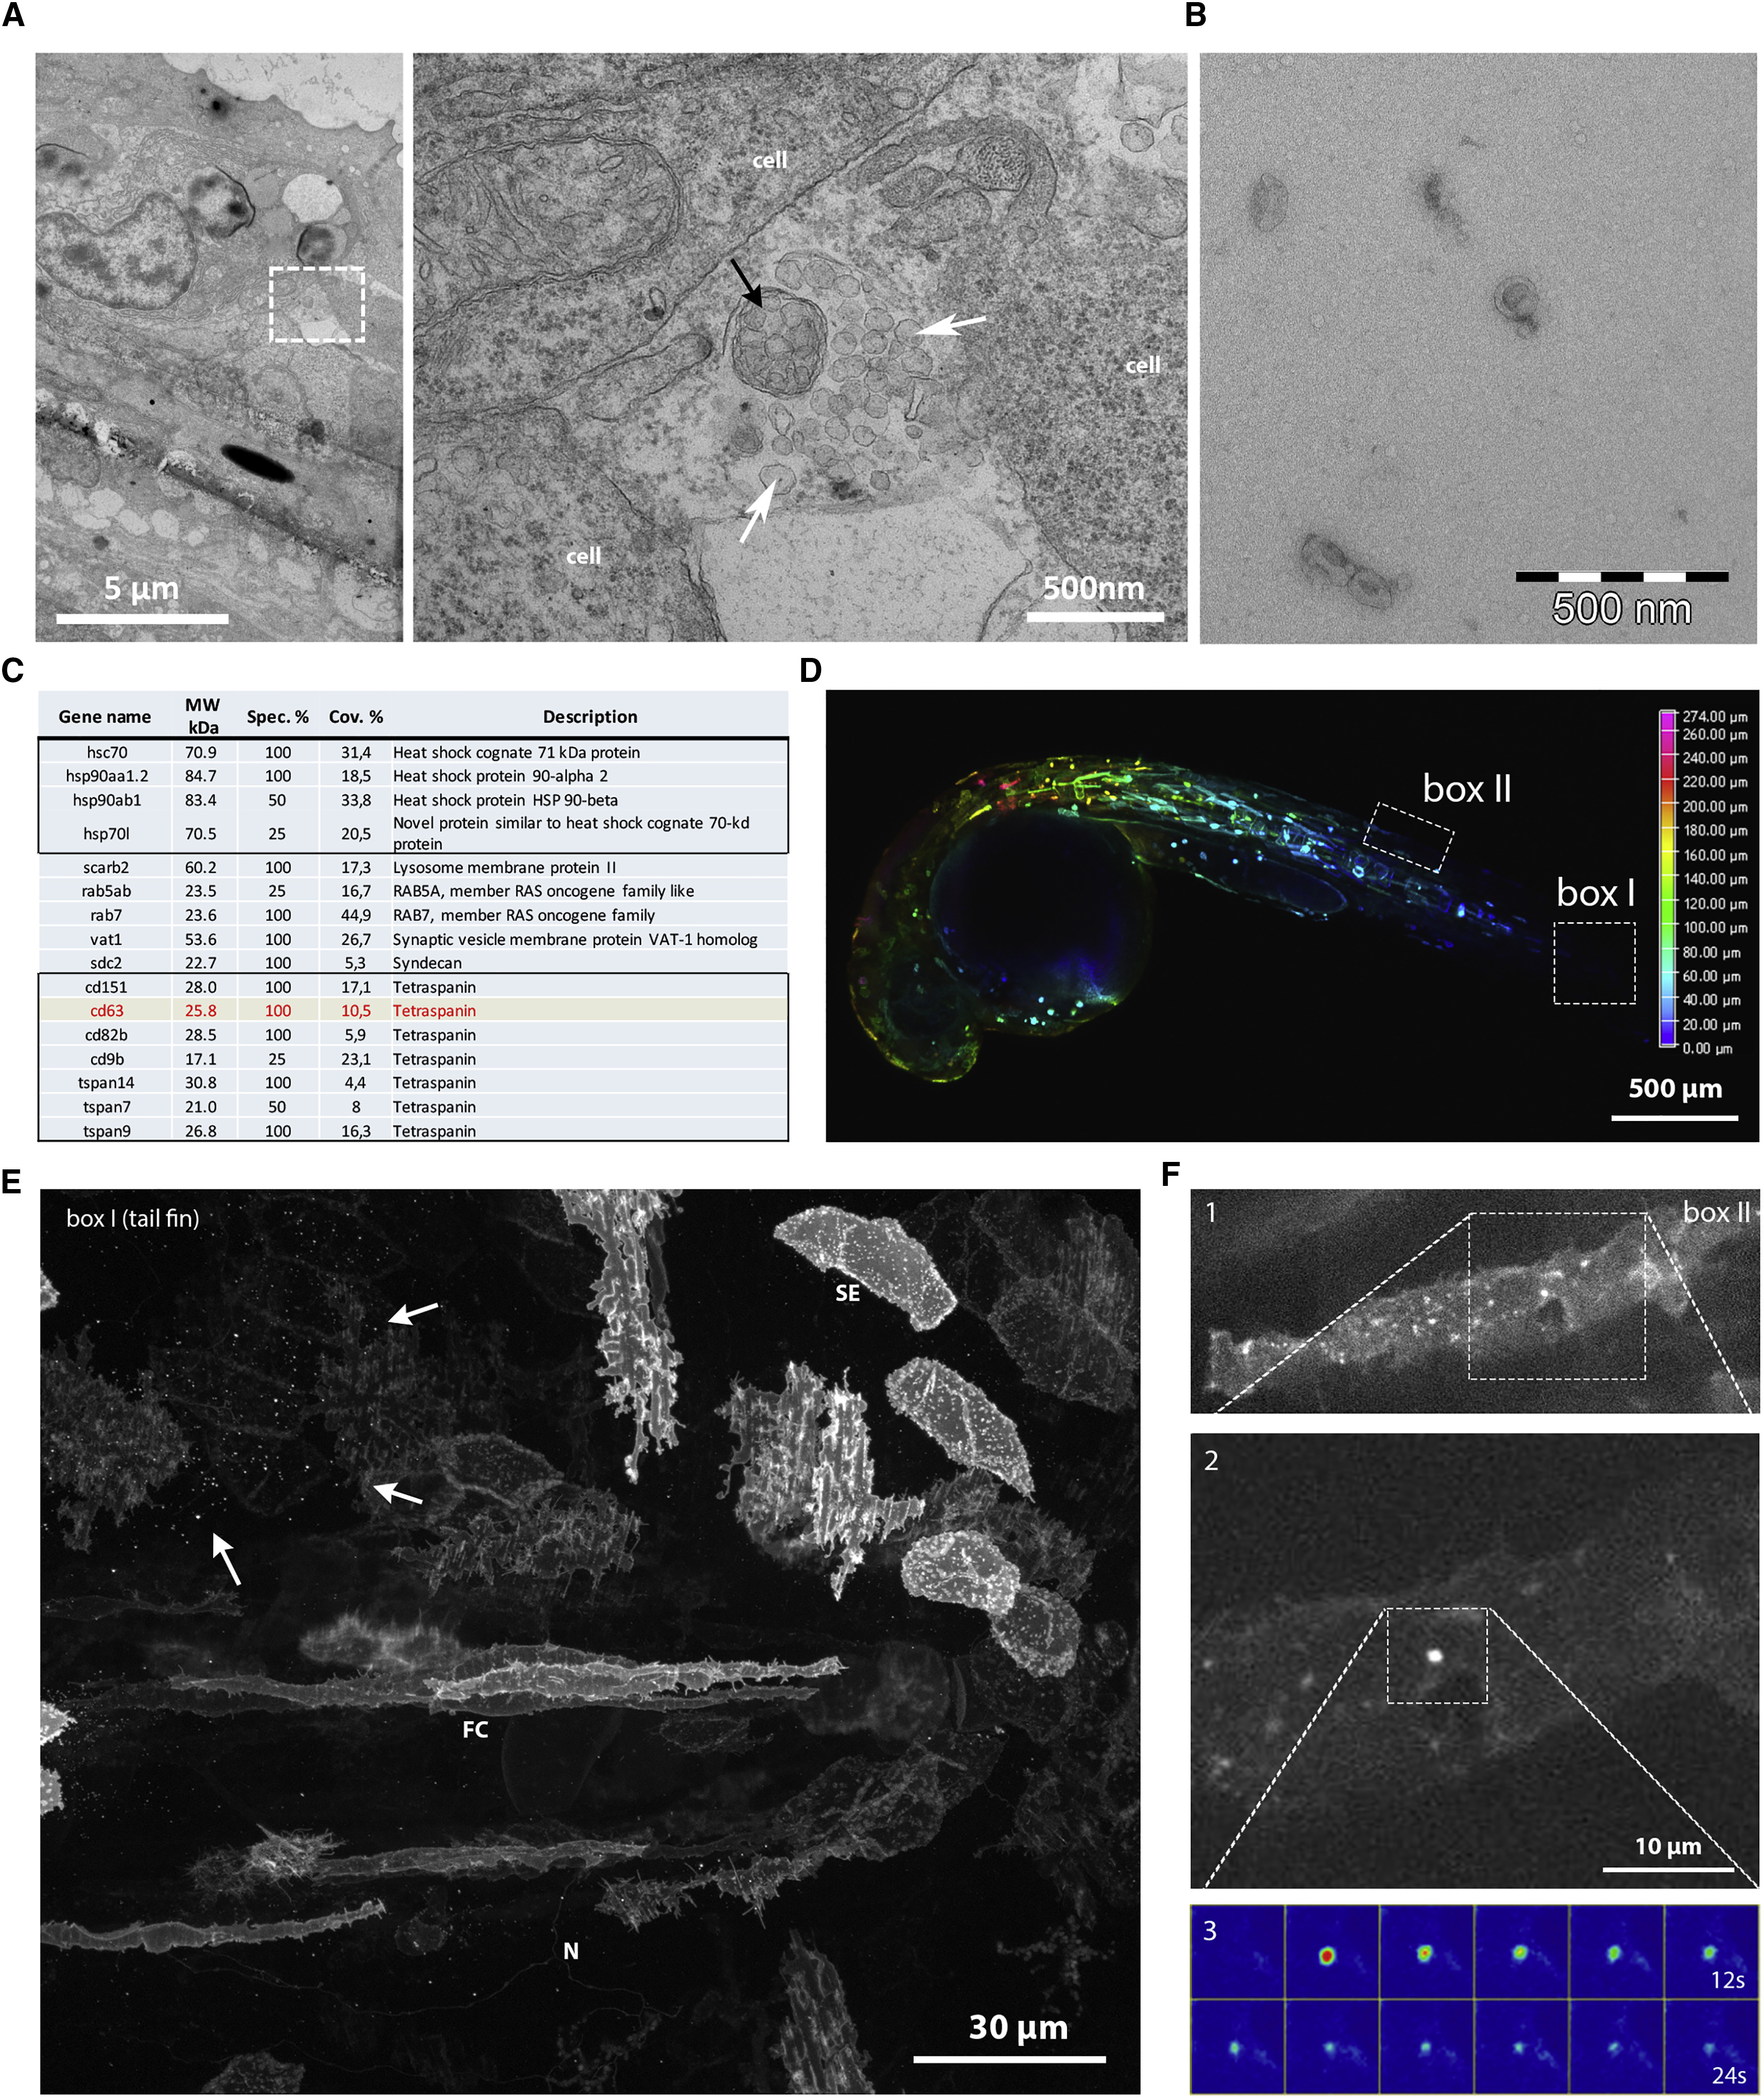
Fig. 1
Identification and In Vivo Visualization of EVs in Zebrafish
(A) Electron microscopic analysis of a 3 dpf zebrafish embryo showing heterogeneous EVs between basal epidermal cells. White arrows indicate exosome-like vesicles, and black arrow indicates an enwrapped cluster of vesicles.
(B) Electron microscopy observation of EVs purified by ultra-centrifugation from the supernatant of AB.9 caudal fibroblastcells.
(C) Mass spectrometry analysis of AB.9-derived EVs (excerpt, complete list in Table S1).
(D) Transient mosaic expression of ubi:CD63-pHluorin in 35 hpf zebrafish embryo, pseudo-colored for depth.
(E) Example of cell types in caudal fin targeted by transient mosaic expression of CD63-pHluorin (3 dpf). Identified as, among others, skin epithelial (SE), neuronal (N), and fibroblast cells (FC). Arrows point at labeled EV.
(F) Example of a fusion event observed in a fibroblast-like cell (1), with zoom in (2), and time-lapse heatmap of the event (3).
Reprinted from Developmental Cell, 48(4), Verweij, F.J., Revenu, C., Arras, G., Dingli, F., Loew, D., Pegtel, M.D., Follain, G., Allio, G., Goetz, J.G., Zimmermann, P., Herbomel, P., Del Bene, F., Raposo, G., van Niel, G., Live Tracking of Inter-organ Communication by Endogenous Exosomes In Vivo, 573-589.e4, Copyright (2019) with permission from Elsevier. Full text @ Dev. Cell