
- Title
-
A cell cycle-coordinated Polymerase II transcription compartment encompasses gene expression before global genome activation
- Authors
- Hadzhiev, Y., Qureshi, H.K., Wheatley, L., Cooper, L., Jasiulewicz, A., Van Nguyen, H., Wragg, J.W., Poovathumkadavil, D., Conic, S., Bajan, S., Sik, A., Hutvàgner, G., Tora, L., Gambus, A., Fossey, J.S., Müller, F.
- Source
- Full text @ Nat. Commun.
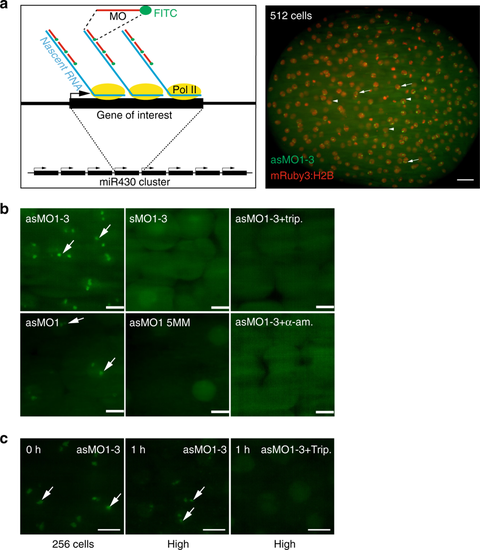
MOVIE detects native transcripts at the site of transcription in living zebrafish embryos. a Left: schematic of the detection principle of transcript imaging by MOVIE at the miR430 primary miRNA gene cluster. Right: Image of whole embryo, imaged in vivo by lightsheet microscopy, injected with three antisense, FITC-labelled morpholinos (MO) targeting miR430 priRNA (green) and mRuby3:H2B fusion protein as nuclear marker (red). Arrows point at signal accumulation, appearing as double green punctae within the nuclei, labelled by mRuby3:H2B (arrowheads). bRepresentative images of live embryos, imaged in vivo at high/oblong by lightsheet microscopy, injected at zygote stage with triple and single sense, antisense and mismatch-containing, FITC-labelled morpholinos and transcription blockers (α-amanitin or triptolide, n = 6 embryos each). c Transcript signal detection before and after 1-hour triptolide treatment started at 256-cell stage (0 h), (n = 6 embryos each). Stages of embryos as indicated in panels. trip triptolide, as antisense, s sense, MO morpholino oligonucleotide (where number depicts specific MO, for details see Supplementary Table 1), 5 MM 5 mismatch containing, h hours after treatment. Scale bars: a 50 µm b, c 10 µm
|
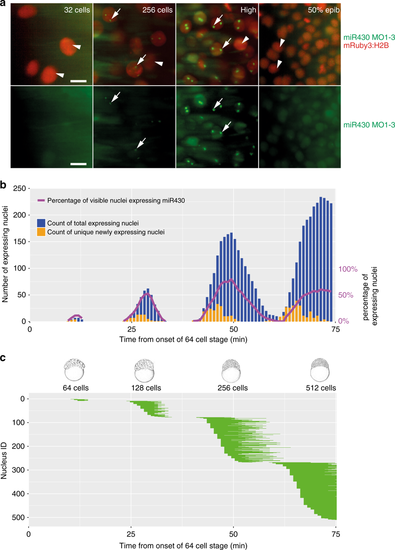
Mapping of gene expression dynamics at cellular resolution indicates that metasynchrony and periodicity follows the short cell cycle phases. a Representative examples of simultaneous detection of miR430 expression by FITC-labelled MO in green (arrows) with mRuby3:H2B-labelled chromatin in red (arrowhead) during at stages as indicated. b Timing of the commencement of gene expression (orange) and number of nuclei (green) showing expression activity, total and new miR430 expressing nuclei per frame. Stages of development are indicated at the bottom of the panels, purple line represent percentage of nuclei expressing miR430 at the time and stages indicated. c Expression span of individual nuclei over time. Each horizontal bar represents the miR430 expression time of a single nucleus. Chart x-axis matches that in (b). Each bar represents signal from up to 2 foci per nucleus. The frame rate (51 s) was used as reference for the elapsed time in (b, c). 50% epib, 50% epiboly. Scale bars: a 10 µm. Source data for (b, c) are provided as a Source Datafile. Zebrafish embryonic stages schematics on panel (b) are reproduced from Kimmel et al., 1995, Developmental Dynamics 203:253-310 by permission of John Wiley & Sons, Inc. |
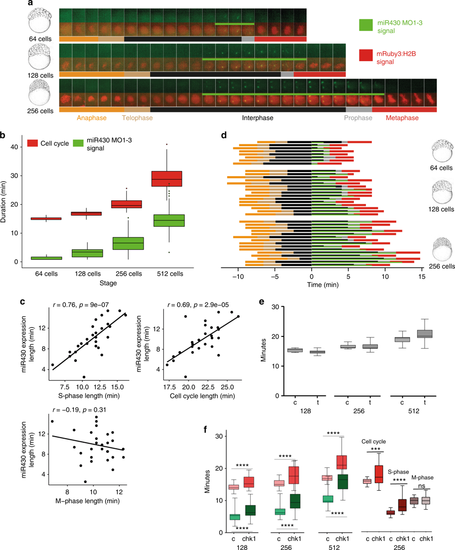
The S-phases of cleavage stage cell cycles are permissive to transcription and/or transcript retention. a Cell cycle length (anaphase to anaphase detected by mRuby3:H2B in red) and miR430 expression (MO signal in green) during early blastula stages. Frames were acquired in 49 s intervals. b Box plot quantification of elongation of miR430 signal (green) alongside cell cycle length (red). Data from 2 embryos are calculated. Total number of nuclei (cell cycle): 64-cell = 17, 128-cell = 60, 256-cell = 62. All groups were significantly different from one another (p < 0.001) (One-way ANOVA with multiple comparisons). Middle line = median. whiskers = nearest hinge ± 1.5 * interquartile range. cCorrelations of cell cycle, S-phase and M-phase length with miR430 expression length, at 256-cell stage (2 embryos, 15 nuclei each). The Pearson correlation coefficient (r) and the corresponding p-value (p) are shown on each plot. d Cell cycle phase segmentation as shown in (a). Horizontal bars represent a nucleus each, they are aligned to onset of detection of miR430 expression and ordered according to length of miR430 expression and cell cycle length. x-axis shows time in minutes. e Effect of triptolide treatment on cleavage stage cell cycle length. Lightsheet microscopic images for nuclear pattern of mRuby3:H2B were analysed to assess cell cycle length and data merged from 4 embryos, 15 nuclei each. Water-injected controls (c) and triptolide-treated (t) are shown at stages as indicated. No statistical difference was found between c and t by Mann–Whitney U test. f Left: relationship between the lengths of cell cycle measured by mRuby3:H2B pattern (red) and pri-miR430 activity detection measured by MO signal (green) in control RNA and chk1 mRNA injected embryos. Data was analysed from 4 embryos, 15 nuclei each at stages as indicated. Statistical significance was measured by Mann–Whitney U test, p < 0.001, whiskers show max and min values. The middle line represents the median. Right: comparison of cell cycle length, S-phase and M-phase for 256 cell stage nuclei, from the chk1 injected and control embryos. Data from 3 embryos, cell cycles compared using Mann–Whitney test, and S and M-phase data compared using unpaired t test. ***P = 0.0004, ****P < 0.0001. Source data for (b–f) are provided as a Source Data file. Zebrafish embryonic stages schematics on panels (a, d) are reproduced from Kimmel et al., 1995, Developmental Dynamics 203:253-310 by permission of John Wiley & Sons, Inc. |
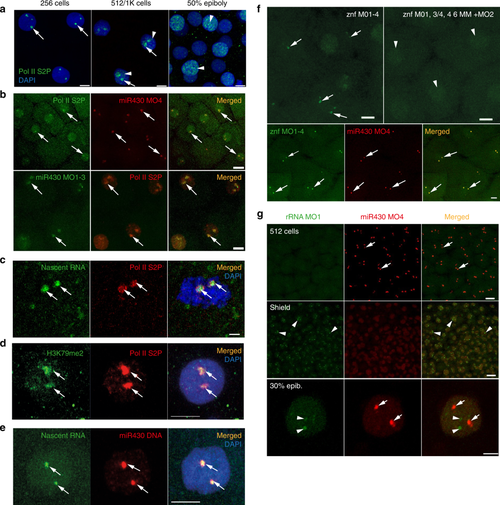
First wave transcription confined into a nuclear compartment. a Immunohistochemistry of Pol II S2P (green) with two main foci (arrows) and broader distribution (arrowheads) at indicated stages. Nuclei DAPI stained (blue). b Top: live imaging of embryos at 256-cell stage, injected with anti Pol II Ser2P Alexa Fluor 488 fab fragments (green) and Cy5-labelled miR430 MO4 (red). Green and red signals colocalise in all nuclei, with both signals detected (n = 3 embryos). Bottom: immunohistochemistry of Pol II S2P (red) and miR430 MO1-3 (green) at high stage; green and red signals colocalise in all nuclei (3 embryos). c Immunohistochemistry of Pol II S2P (red) and nascent RNA detection (green) by ethynyl-uridine (EU) incorporation and Alexa Fluor 488 tagging at 256-cell stage. Green and red signals colocalise in all nuclei (49 nuclei, 6 embryos). d Immunohistochemistry for H3K79me2 (green) and Pol II Ser2P (red) and merged image with DAPI (blue) of 512-cell stage embryos. Third panel shows merge with DAPI (8 nuclei, 3 embryos). e Staining for the miR430 locus (red) in combination with nascent RNA detection (green) by EU at 512-cell stage. Merged panel shows DAPI in blue (n = 37 nuclei, 3 embryos). f Top panels: live detection of activity of a cluster of znf genes at 512-cell stage by fluorescein-labelled MOs, injected with mix of targeting (left) or mismatch-containing MOs (right) (n = 3 embryos each). Bottom panels: embryo co-injected with miR430 MO4 (red) and znf targeting MOs (green) at 256-cell stage. Green and red signals colocalised in all nuclei (n = 6 embryos). In panels (b–f) arrows point at transcription foci. g Top: Airyscan images of embryo (at 512-cell and shield stages) co-injected with MOs targeting the 5′ETS of 45 S ribosomal RNA precursor (green) and miR430 MO4 (red) (n = 4 embryos for each stage). Bottom: confocal Airyscan image of 30% epiboly embryo injected with the same reagents. miR430 MO4 signal accumulation (arrows) and rRNA_5’ETS_MO1 (arrowheads) are indicated. znf zinc finger gene, Pol II S2P RNA polymerase II serine-2 phosphorylated, rRNA ribosomal RNA, ETS external transcribed spacer, Scale bars (µm): a 10, b top 20, bottom 10, c 2, d, e 5, f 10, g top 20, bottom 5 |
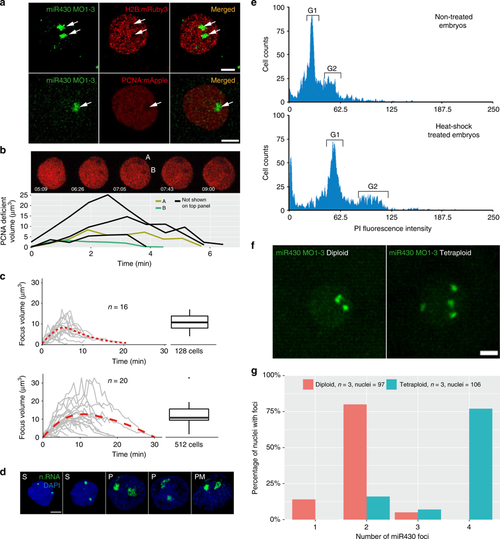
Relationship of the transcription compartment with the nuclear architecture. a Confocal Airyscan image of 512-cell stage embryos co-injected with miR430 MOs (green) and either mRuby3:H2B (top) or mApple:PCNA (bottom) fusion proteins (red). Arrows indicate low density chromatin at the site of miR430 activity. b Time-lapse of 512-cell stage nucleus, injected with mApple:PCNA fusion proteins (red). Image shows individual z-slices from within the nucleus exhibiting two PCNA deficient regions. Graph below shows the evolution of the individual depicted PCNA deficient regions over time (A & B), in addition to deficient regions from other 512-cell stage nuclei from the same embryo, detected using spot detection plugin in Icy Bioimage. Time indicates duration from first detection of PCNA signal within the cell cycle in seconds and minutes. c Charts representing the transcription focus volume over time based on miR430 MO signal, measured using spot detection plugin Icy Bioimage software, top panel: 128-cell stage, bottom: 512-cell stage. Boxplots on the right show variation in peak volume. Middle line = median. whiskers = nearest hinge ± 1.5 * interquartile range. d Nascent RNA detection (green) by ethynyl-uridine incorporation and subsequent Alexa fluor 488 tagging of embryos fixed in 4 min intervals within 512-cells stage, demonstrating different stages of the transcription compartment structure during the cell cycle. e DNA content of 12-somite stage embryos untreated and heat-shocked was determined by propidium iodide DNA staining analysis. FACS traces show a shift in the position of the Gap phase 1 (G1) and Gap phase 2 (G2) peaks (marked), between the heat-shock untreated and treated groups, in accordance with a doubling in DNA content in the heat-shocked group. f Representative images of miR430 MO-injected diploid and induced polypoid 256-cell stage embryos (green). g Bar chart showing comparison of miR430 foci number between diploid and tetraploid embryos. n.RNA nascent RNA, S S-phase, P prophase, PM prometaphase; Scale bar, 5 µm. Source data for (b, c, g) are provided as a Source Data file.
|