
Fig. 3
- ID
- ZDB-FIG-190625-40
- Publication
- Hadzhiev et al., 2019 - A cell cycle-coordinated Polymerase II transcription compartment encompasses gene expression before global genome activation
- Other Figures
- All Figure Page
- Back to All Figure Page
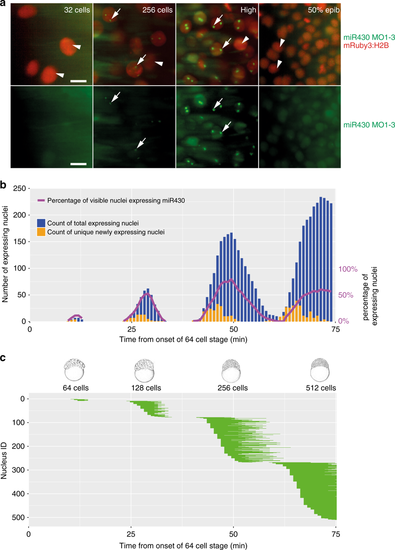
Mapping of gene expression dynamics at cellular resolution indicates that metasynchrony and periodicity follows the short cell cycle phases. a Representative examples of simultaneous detection of miR430 expression by FITC-labelled MO in green (arrows) with mRuby3:H2B-labelled chromatin in red (arrowhead) during at stages as indicated. b Timing of the commencement of gene expression (orange) and number of nuclei (green) showing expression activity, total and new miR430 expressing nuclei per frame. Stages of development are indicated at the bottom of the panels, purple line represent percentage of nuclei expressing miR430 at the time and stages indicated. c Expression span of individual nuclei over time. Each horizontal bar represents the miR430 expression time of a single nucleus. Chart x-axis matches that in (b). Each bar represents signal from up to 2 foci per nucleus. The frame rate (51 s) was used as reference for the elapsed time in (b, c). 50% epib, 50% epiboly. Scale bars: a 10 µm. Source data for (b, c) are provided as a Source Datafile. Zebrafish embryonic stages schematics on panel (b) are reproduced from Kimmel et al., 1995, Developmental Dynamics 203:253-310 by permission of John Wiley & Sons, Inc. |