
|
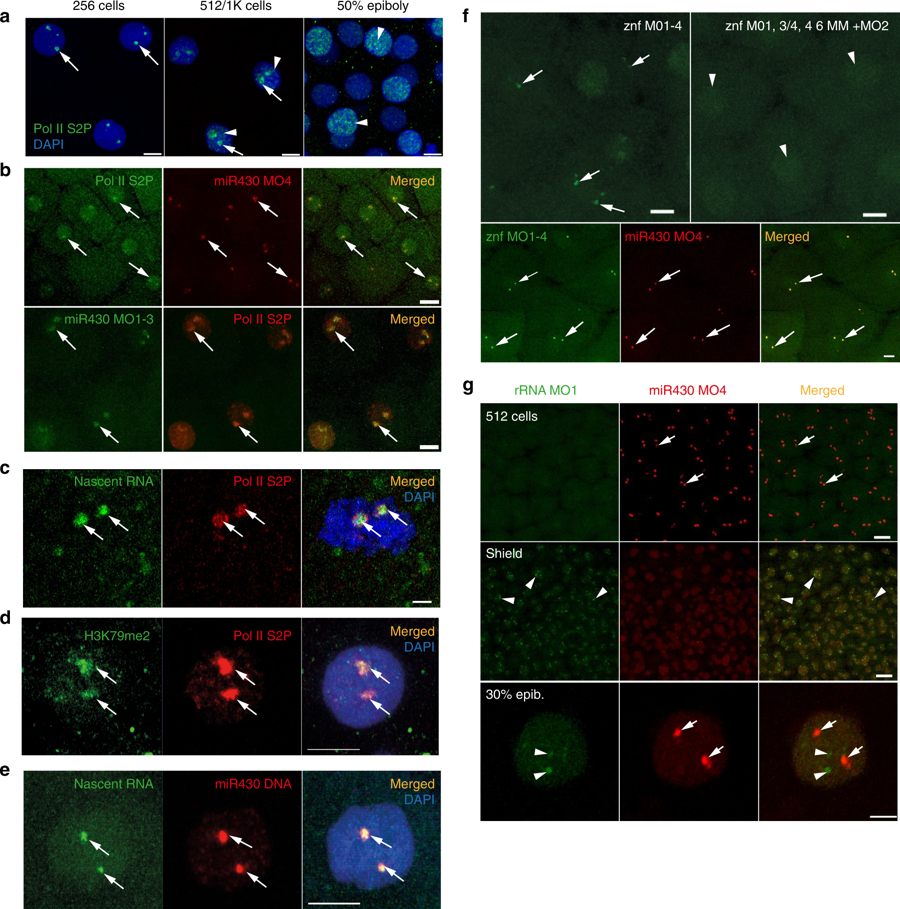
Fig. 5
First wave transcription confined into a nuclear compartment. a Immunohistochemistry of Pol II S2P (green) with two main foci (arrows) and broader distribution (arrowheads) at indicated stages. Nuclei DAPI stained (blue). b Top: live imaging of embryos at 256-cell stage, injected with anti Pol II Ser2P Alexa Fluor 488 fab fragments (green) and Cy5-labelled miR430 MO4 (red). Green and red signals colocalise in all nuclei, with both signals detected (n = 3 embryos). Bottom: immunohistochemistry of Pol II S2P (red) and miR430 MO1-3 (green) at high stage; green and red signals colocalise in all nuclei (3 embryos). c Immunohistochemistry of Pol II S2P (red) and nascent RNA detection (green) by ethynyl-uridine (EU) incorporation and Alexa Fluor 488 tagging at 256-cell stage. Green and red signals colocalise in all nuclei (49 nuclei, 6 embryos). d Immunohistochemistry for H3K79me2 (green) and Pol II Ser2P (red) and merged image with DAPI (blue) of 512-cell stage embryos. Third panel shows merge with DAPI (8 nuclei, 3 embryos). e Staining for the miR430 locus (red) in combination with nascent RNA detection (green) by EU at 512-cell stage. Merged panel shows DAPI in blue (n = 37 nuclei, 3 embryos). f Top panels: live detection of activity of a cluster of znf genes at 512-cell stage by fluorescein-labelled MOs, injected with mix of targeting (left) or mismatch-containing MOs (right) (n = 3 embryos each). Bottom panels: embryo co-injected with miR430 MO4 (red) and znf targeting MOs (green) at 256-cell stage. Green and red signals colocalised in all nuclei (n = 6 embryos). In panels (b–f) arrows point at transcription foci. g Top: Airyscan images of embryo (at 512-cell and shield stages) co-injected with MOs targeting the 5′ETS of 45 S ribosomal RNA precursor (green) and miR430 MO4 (red) (n = 4 embryos for each stage). Bottom: confocal Airyscan image of 30% epiboly embryo injected with the same reagents. miR430 MO4 signal accumulation (arrows) and rRNA_5’ETS_MO1 (arrowheads) are indicated. znf zinc finger gene, Pol II S2P RNA polymerase II serine-2 phosphorylated, rRNA ribosomal RNA, ETS external transcribed spacer, Scale bars (µm): a 10, b top 20, bottom 10, c 2, d, e 5, f 10, g top 20, bottom 5