FIGURE SUMMARY
Title

CPSF1 mutations are associated with early-onset high myopia and involved in retinal ganglion cell axon projection

Authors
Ouyang, J., Sun, W., Xiao, X., Li, S., Jia, X., Zhou, L., Wang, P., Zhang, Q.
Source
Full text @ Hum. Mol. Genet.

Knockdown of cpsf1 in zebrafish caused abnormal ocular morphogenesis. (A) Diagram illustrating the structure of exons 5 to 11 of the zebrafish cpsf1 gene, the cpsf1 MO targeting sites, and the primers used to test splicing products before and after cpsf1 MO microinjection. (B) Eye size in zebrafish at 3 dpf. Left: microinjection of std MO (4 ng), middle: microinjection of cpsf1 MO (4 ng), right: co-injection of cpsf1 MO (4 ng) and cpsf1-mRNA (200 pg). The eye diameter (eye size) was 294.09 ± 10.28 μm (n = 68) for the std control, 263.55 ± 20.85 μm (n = 64) for the cpsf1 morphants and 289.97 ± 15.47 μm (n = 87) for the zebrafish subjected to cpsf1-MO/cpsf1-mRNA co-injection. Small eye size was detected in cpsf1 morphants, but this phenotype could be rescued by 200 pg of cpsf1-mRNA. Std MO-injected zebrafish were used as a control in this study. (C) The efficiency of cpsf1 MO knockdown was tested by RT-PCR using the primers shown in (A). The amplicons from WT and std MO-injected zebrafish RNA were 681 bp, while cpsf1 MO disrupted the splicing of e9i9, resulting in the occurrence of a larger amplicon of 2075 bp at 24 hours post fertilization (hpf). (D) Quantification of small eye size proportions in zebrafish at 3 dpf. The data showed that the proportion of small eye size was significantly increased in cpsf1 morphants compared to that of the std control (P = 4.77 × 10−15), and the small eye size phenotype could be rescued by cpsf1-mRNA (P = 8.87 × 10−14) based on the Chi-square test (P < 0.017, or 0.05/3, was considered as statistically significant). The number of zebrafish injected in each group is indicated under each column.

PHENOTYPE:
Fish:
Knockdown Reagent:
Observed In:
Stage: Protruding-mouth

Co-injection of cpsf1 MO and p53 MO in zebrafish failed to rescue the small eye size phenotype. (A) Eye size in zebrafish at 3 dpf. The eye diameter (eye size) was 293.83 ± 10.17 μm (n = 67) for the std control, 261.75 ± 21.04 μm (n = 51) for the cpsf1 morphants, and 261.86 ± 19.67 μm (n = 55) for the zebrafish subjected to cpsf1-MO/p53 MO co-injection. Small eye size was detected in cpsf1 morphants, but this phenotype could not be rescued by p53 MO. Std MO-injected zebrafish were used as a control in this study. (B) Quantification of small eye size proportions in zebrafish at 3 dpf. The proportion of small eye size was significantly increased in cpsf1 morphants compared to that of the std control (P = 6.06 × 10−14), but it was still increased compared to that in the std control after co-injection of cpsf1 MO and p53 MO (P = 7.90 × 10−15) based on the Chi-square test (P < 0.017, or 0.05/3, was considered as statistically significant). The number of zebrafish injected in each group is indicated under each column.

PHENOTYPE:
Fish:
Knockdown Reagents:
Observed In:
Stage: Protruding-mouth

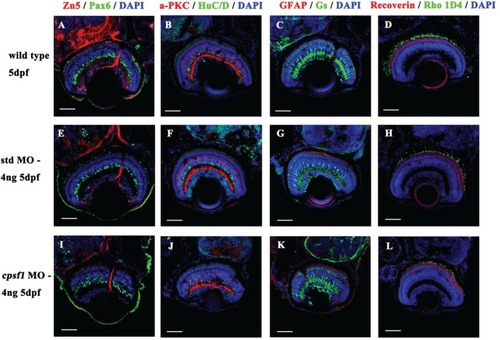
Retinal cells developed normally in WT larvae (A-D), std MO larvae (E-H) and cpsf1 morphants (I–L). (A, E, I) Co-labelling with anti-Pax6 (for ganglion and amacrine precursor cells, green) and anti-Zn5 (for mature RGCs and their axons, red) antibodies showed that the RGCs were mature. (B, F, J) Co-labelling with anti-HuC/D (for ganglion cells and amacrine cells, green) and anti-α PKC (for bipolar cells, red) antibodies indicated that the amacrine cells and bipolar cells developed normally. (C, G, K) Co-labelling with anti-GS (for Müller cells, green) and anti-GFAP (for glial cells and their axons, red) antibodies demonstrated that the Müller cells and glial cells had attained maturity. (D, H, L) Co-labelling with anti-Rho 1D4 (for long double-cone outer segments, green) and anti-Recoverin (for cone bipolar cells, red) antibodies demonstrated that the photoreceptors grew normally.

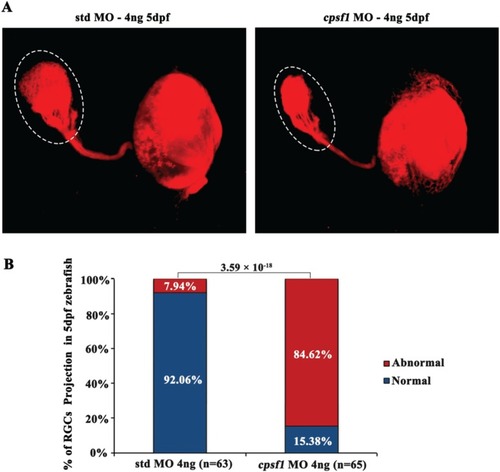
RGC axon projection to the tectum was abnormal in cpsf1 morphants. (A) RGC axon projection in zebrafish at 5 dpf. Left: RGC axon projection in std MO-injected zebrafish, right: RGC axon projection in cpsf1 morphants. Data showed that cpsf1 morphants showed less innervation to the tectum than std MO-injected zebrafish. (B) Histogram of the percentage of larvae with the phenotype of reduced innervation of the tectum. The area of the tectum with DiI tracing was 18570.60 ± 3969.32 μm2 (n = 63) in std MO-injected zebrafish, and 8895.07 ± 3756.63 μm2 (n = 65) in cpsf1 MO-injected zebrafish. Approximately 84.62% of cpsf1 morphants displayed reduced area of the tectum, but only 7.94% of std MO-injected zebrafish had this phenotype (P = 3.59 × 10−18, Chi-square test). The number of zebrafish injected in each group is indicated under each column.

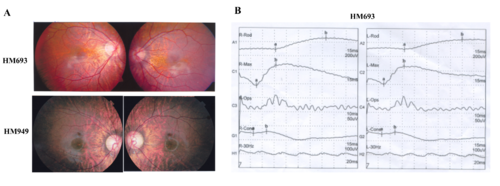
. Available fundus changes of the probands HM693 and HM949 and ERG recording of the proband HM693. (A) Typical fundus changes of high myopia, including an optic nerve head crescent and a “tigroid” appearance of the posterior retina. (B) ERG recording of the proband HM693 showed severely reduced cone responses and mildly reduced rod responses

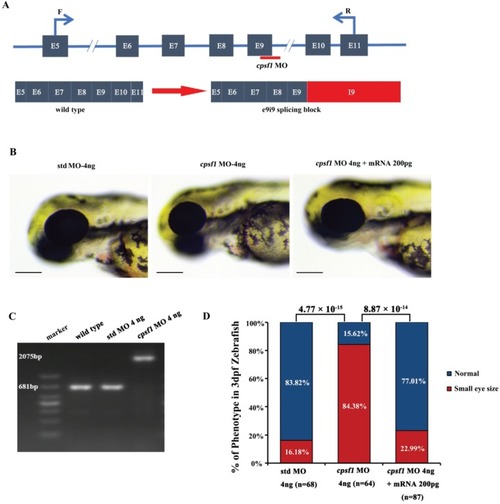
Knockdown of cpsf1 at different doses in zebrafish caused differences in ocular morphogenesis. (A) Phenotype of MO-injected zebrafish. Upper: microinjection with 2 ng, 4 ng, or 6 ng of std MO; lower: microinjection with 2 ng, 4 ng, or 6 ng of cpsf1 MO. The data showed that body and eye size were normal after injecting 2 ng, 4 ng, or 6 ng of std MO. Three phenotypes were observed in the cpsf1 morphants and classified based on degree (mild, moderate or severe) following injection with 2 ng, 4 ng or 6 ng of cpsf1 MO. (B) Quantification of small eye size proportions in zebrafish at 3 dpf. The eye diameter (eye size) was 290.58 ± 17.94 μm (n=45) for zebrafish injected with std MO (2 ng) and 289.58 ± 28.84 μm (n= 60) for zebrafish injected with cpsf1 MO (2 ng); 285.28 ± 12.25μm (n=51) for zebrafish injected with std MO (4 ng) and 250.03 ± 32.31 μm (n=74) for zebrafish injected with cpsf1-MO (4 ng); and 285.06 ± 15.80 μm (n=57) for zebrafish injected with std MO (6 ng) and 212.64 ± 28.68 μm (n=83) for zebrafish injected with cpsf1-MO (6 ng). The data showed that the proportion of small eye size was significantly increased in cpsf1 morphants injected with 4 ng and 6 ng of cpsf1 MO than in those injected with the std control (P= 4.66 × 10⁻¹⁰ for 4 ng and P= 9.17 × 10⁻¹⁷ for 6 ng), but there was no difference between the cpsf1 morphants injected with 2 ng of cpsf1 MO and those injected with the std control (P = 0.88) based on Chi-square test (P<0.05 was considered as statistically significant). The number of zebrafish injected in each group is indicated under each column.

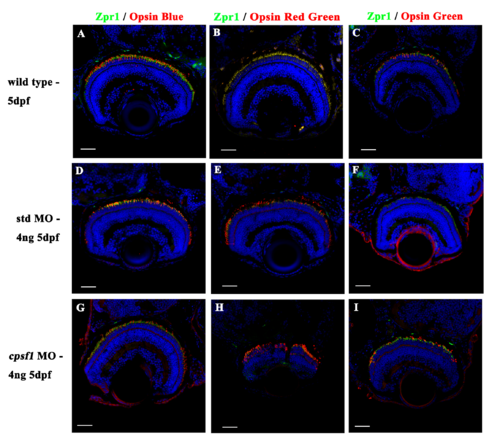
Photoreceptor cells developed normally in wild-type larvae (A-C), std MO larvae (D-F), and cpsf1 morphants (G-I). (A, D, G): Co-labelling with anti-Zpr1 (for double-cone photoreceptor cells, green) and anti-Opsin Blue (for blue cone photoreceptor cells, red) antibodies showed that the blue cone photoreceptor cells were mature. (B, E, H): Co-labelling with anti-Zpr1 (for double-cone photoreceptor cells, green) and anti-Opsin Red/Green (for red/green cone photoreceptor cells, red) antibodies indicated that the red and green cone photoreceptor cells developed normally. (C, F, I): Co-labelling with anti-Zpr1 (for double-cone photoreceptor cells, green) and anti-Opsin Green (for green cone photoreceptor cells, red) antibodies demonstrated that the green cone photoreceptor cells attained maturity.

EXPRESSION / LABELING:
Antibodies:
Fish:
Knockdown Reagent:
Anatomical Term:
Stage: Day 5
Acknowledgments
This image is the copyrighted work of the attributed author or publisher, and ZFIN has permission only to display this image to its users. Additional permissions should be obtained from the applicable author or publisher of the image. Full text @ Hum. Mol. Genet.