IMAGE

Figure 7

ID
ZDB-IMAGE-190723-1754
Source
Figures for Ouyang et al., 2019
Image
Figure Caption

Figure 7

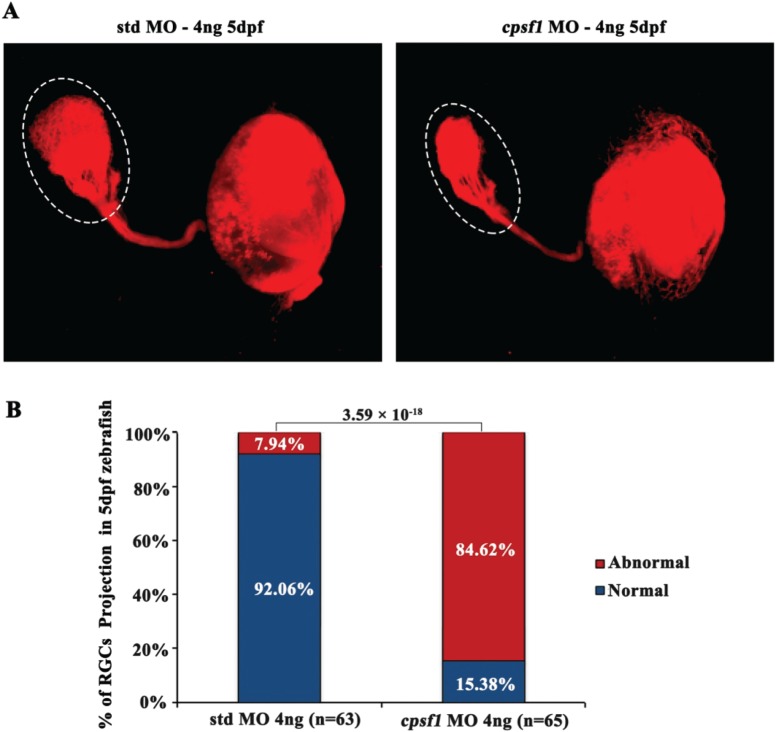
RGC axon projection to the tectum was abnormal in cpsf1 morphants. (A) RGC axon projection in zebrafish at 5 dpf. Left: RGC axon projection in std MO-injected zebrafish, right: RGC axon projection in cpsf1 morphants. Data showed that cpsf1 morphants showed less innervation to the tectum than std MO-injected zebrafish. (B) Histogram of the percentage of larvae with the phenotype of reduced innervation of the tectum. The area of the tectum with DiI tracing was 18570.60 ± 3969.32 μm2 (n = 63) in std MO-injected zebrafish, and 8895.07 ± 3756.63 μm2 (n = 65) in cpsf1 MO-injected zebrafish. Approximately 84.62% of cpsf1 morphants displayed reduced area of the tectum, but only 7.94% of std MO-injected zebrafish had this phenotype (P = 3.59 × 10−18, Chi-square test). The number of zebrafish injected in each group is indicated under each column.

Figure Data
Acknowledgments
This image is the copyrighted work of the attributed author or publisher, and ZFIN has permission only to display this image to its users. Additional permissions should be obtained from the applicable author or publisher of the image. Full text @ Hum. Mol. Genet.