FIGURE SUMMARY
Title

Screening for insulin-independent pathways that modulate glucose homeostasis identifies androgen receptor antagonists

Authors
Mullapudi, S.T., Helker, C.S., Boezio, G.L., Maischein, H.M., Sokol, A.M., Guenther, S., Matsuda, H., Kubicek, S., Graumann, J., Yang, Y.H.C., Stainier, D.Y.
Source
Full text @ Elife

ZFIN is incorporating published figure images and captions as part of an ongoing project. Figures from some publications have not yet been curated, or are not available for display because of copyright restrictions.

ZFIN is incorporating published figure images and captions as part of an ongoing project. Figures from some publications have not yet been curated, or are not available for display because of copyright restrictions.

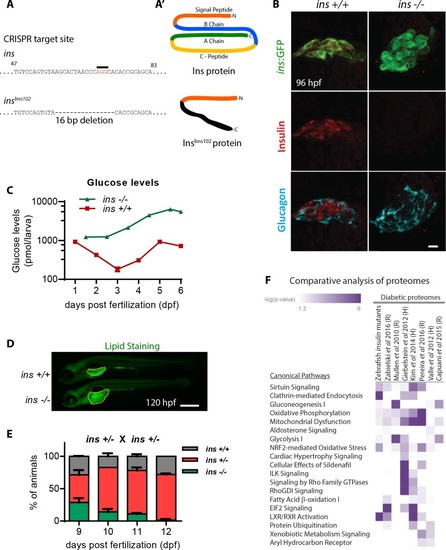
(A) CRISPR target site in the insulin gene, with PAM sequence highlighted, and the resulting 16 bp deletion allele (below). (A’) Schematic of wild-type Insulin protein and the predicted mutant protein which contains novel sequence (black). (B) Confocal projection images of the pancreatic islet in 96 hpf Tg(ins:GFP) ins +/+ and ins -/- animals immunostained for Insulin (red) and Glucagon (cyan). (C) Free glucose levels in wild-type and mutant animals from 1 to 6 dpf; mean ± SEM, n = 2–4 replicates. (D) Nile Red staining (green) for neutral lipids in 120 hpf wild-type (top) and mutant (bottom) larvae, with yolk lipid content outlined (yellow dots). (E) Genotype distribution from ins ± incross, calculated as the percentage of total animals at each stage; mean ± SEM, n = 32 animals at each stage. (F) Heat map of the proteomic signature of zebrafish ins mutants at 120 hpf compared to signatures from rodent (R) and human (H) diabetic proteome studies. Canonical pathways implicated in most studies are listed first. P-value cut-off set at <0.05. Scale bars: 10 μm (B), 500 μm (D).

<italic>ins,</italic> and not <italic>insb</italic>, is the predominant paralog expressed in zebrafish pancreatic islets.

(A) Brightfield images of 72 hpf wild-type, ins mutant and insb mutant larvae. (B–C) Confocal plane images of the pancreatic islet in 72 hpf wild-type and insb mutant larvae stained for Insulin (white). (D) Fasting blood glucose levels in three mpf wild-type and ins ± animals; mean ± SEM, n = 11 animals. (E) Body length measurements of 50 dpf wild-type and ins ± animals; mean ± SEM, n = 5–6 animals. (F) mRNA expression time course of ins and insb during zebrafish development from 0 to 120 hpf. (G) 4 ng of control (ctrl) or ins morpholino (MO) was injected in non-transgenic or Tg(ins:insb) (insb OE) embryos at the one cell stage and glucose levels measured at 96 hpf; mean ± SEM, n = 3 replicates. Scale bars: 250 μm (A), 5 μm (C, D). P values from t-tests.

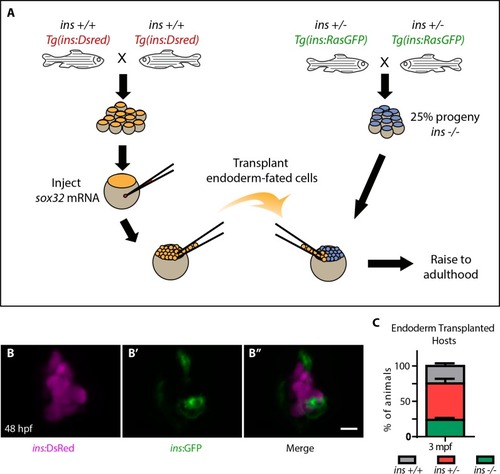
(A) Schematic depicting the endoderm transplantation protocol; sox32 mRNA-injected ins +/+ donor cells (orange) were transplanted into host embryos (blue) to form chimeric animals. (B–B’’) Confocal projection images of the pancreatic islet of a 48 hpf chimeric animal showing β-cells from the host (green, (B’) and the transplanted ins +/+ cells (magenta, (B). (C) Genotype distribution in the raised three mpf chimeric animals, determined by genotyping fin tissue; mean ± SEM, n = 3 transplant experiments, 18–32 animals per experiment. Scale bar: 10 μm.

<italic>sox32</italic> mRNA-injected cells contribute to host endoderm upon transplantation.

(A–A”) Confocal images of a 48 hpf host embryo injected with H2B-mCherry mRNA (magenta) and transplanted with Tg(sox17:GFP) expressing donor endoderm showing the chimeric islet (yellow arrowhead). (B) High-resolution melt analysis patterns for genotyping ins +/+ (blue), ins +/- (green) and ins -/- (brown) animals. (C) Representative example of genotyping 31 chimeric adults, revealing 8 of 31 animals to be mutant (brown). Scale bar: 200 μm.

Flutamide reduces glucose levels in a dose-dependent manner, possibly exerting its effects through liver gluconeogenic enzymes.

(A) Dose response curve of the glucose lowering effect of flutamide in ins mutant larvae, treated from 84 to 120 hpf; mean ± SEM, n = 3 replicates. (B) Wholemount in situ hybridization for ar expression in 120 hpf wild-type and ins mutant larvae showing signal in the brain and liver (red arrowheads). (C) The 12 genes differentially regulated in ins mutants compared to non-mutant siblings and modulated in the opposite direction upon treatment with flutamide or cyproterone compared to DMSO; listed with their fold change (Log2 scale) and expression levels under control condition (base mean reads); genes are ordered by the fold change in the flutamide vs DMSO condition. (D) Schematic of insig1 and btg2 gene loci, with location of transcription start site (TSS) and androgen response elements (ARE, blue arrowheads). (E) Schematic of vehicle vs flutamide treatment of Tg(ins:NTR) adult animals following β-cell ablation with metronidazole (MTZ) injection to induce hyperglycemia. Scale bar: 250 μm.

EXPRESSION / LABELING:
Gene:
Fish:
Anatomical Terms:
Stage: Day 5
Acknowledgments
This image is the copyrighted work of the attributed author or publisher, and ZFIN has permission only to display this image to its users. Additional permissions should be obtained from the applicable author or publisher of the image. Full text @ Elife