
|
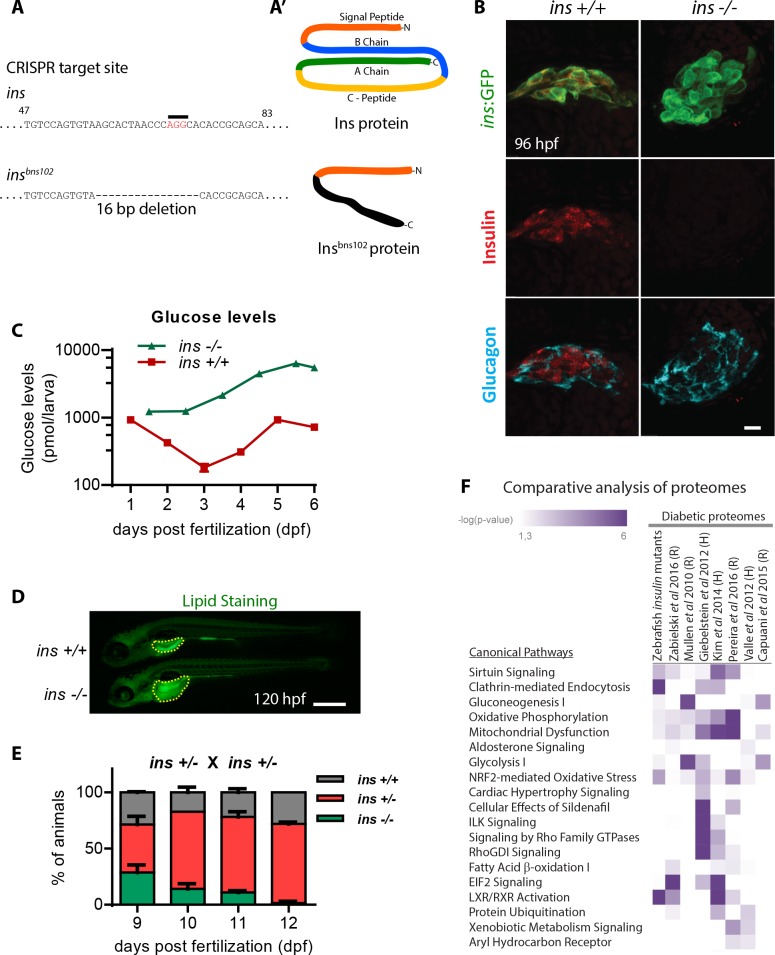
Figure 1 (A) CRISPR target site in the insulin gene, with PAM sequence highlighted, and the resulting 16 bp deletion allele (below). (A’) Schematic of wild-type Insulin protein and the predicted mutant protein which contains novel sequence (black). (B) Confocal projection images of the pancreatic islet in 96 hpf Tg(ins:GFP) ins +/+ and ins -/- animals immunostained for Insulin (red) and Glucagon (cyan). (C) Free glucose levels in wild-type and mutant animals from 1 to 6 dpf; mean ± SEM, n = 2–4 replicates. (D) Nile Red staining (green) for neutral lipids in 120 hpf wild-type (top) and mutant (bottom) larvae, with yolk lipid content outlined (yellow dots). (E) Genotype distribution from ins ± incross, calculated as the percentage of total animals at each stage; mean ± SEM, n = 32 animals at each stage. (F) Heat map of the proteomic signature of zebrafish ins mutants at 120 hpf compared to signatures from rodent (R) and human (H) diabetic proteome studies. Canonical pathways implicated in most studies are listed first. P-value cut-off set at <0.05. Scale bars: 10 μm (B), 500 μm (D).