FIGURE

Figure 4—figure supplement 1.

ID
ZDB-FIG-190723-1918
Publication
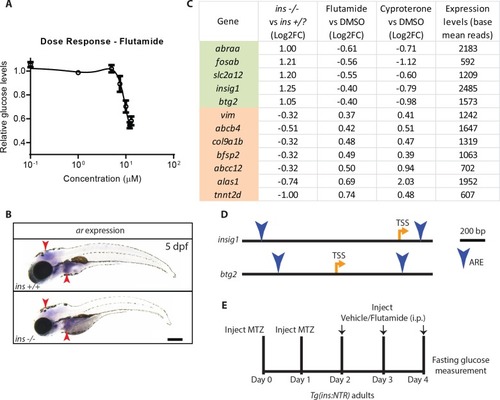
Mullapudi et al., 2018 - Screening for insulin-independent pathways that modulate glucose homeostasis identifies androgen receptor antagonists
Other Figures
All Figure Page
Back to All Figure Page
Figure 4—figure supplement 1.

Flutamide reduces glucose levels in a dose-dependent manner, possibly exerting its effects through liver gluconeogenic enzymes.

(A) Dose response curve of the glucose lowering effect of flutamide in ins mutant larvae, treated from 84 to 120 hpf; mean ± SEM, n = 3 replicates. (B) Wholemount in situ hybridization for ar expression in 120 hpf wild-type and ins mutant larvae showing signal in the brain and liver (red arrowheads). (C) The 12 genes differentially regulated in ins mutants compared to non-mutant siblings and modulated in the opposite direction upon treatment with flutamide or cyproterone compared to DMSO; listed with their fold change (Log2 scale) and expression levels under control condition (base mean reads); genes are ordered by the fold change in the flutamide vs DMSO condition. (D) Schematic of insig1 and btg2 gene loci, with location of transcription start site (TSS) and androgen response elements (ARE, blue arrowheads). (E) Schematic of vehicle vs flutamide treatment of Tg(ins:NTR) adult animals following β-cell ablation with metronidazole (MTZ) injection to induce hyperglycemia. Scale bar: 250 μm.

Expression Data
Gene:
Fish:
Anatomical Terms:
Stage: Day 5

Expression Detail
Antibody Labeling
Phenotype Data

Phenotype Detail
Acknowledgments
This image is the copyrighted work of the attributed author or publisher, and ZFIN has permission only to display this image to its users. Additional permissions should be obtained from the applicable author or publisher of the image. Full text @ Elife