
- Title
-
Critical Role for a Subset of Intestinal Macrophages in Shaping Gut Microbiota in Adult Zebrafish
- Authors
- Earley, A.M., Graves, C.L., Shiau, C.E.
- Source
- Full text @ Cell Rep.
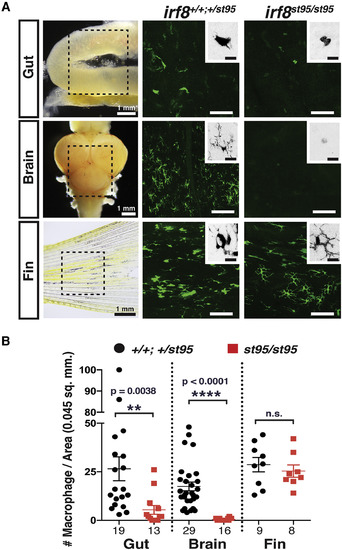
Adult irf8−/− Zebrafish Have a Severe Loss of Tissue-Resident Intestinal and Brain Macrophages but Normal Numbers of Peripheral Macrophages (A) Image analysis was performed on whole-mount gut, brain, and fin dissected from transgenic adult zebrafish expressing the macrophage-specific reporter mpeg1:GFP. Left column shows images of dissected organs and the general region from which several areas were quantified and analyzed (dotted box). Each image represents a quantified 0.045 mm2 field of view. High-magnification insets show an inverted image of a GFP+ macrophage. No clear microglia were detected in irf8 mutant brains. Scale bars in GFP image panels are 50 μm and in insets are 10 μm. (B) Scatterplot shows macrophage number per field of view in each tissue region. Numbers below plot represent the number of areas analyzed from 4 or more animals. Statistical significance was determined by a two-tailed t test. ∗∗p < 0.01, ∗∗∗∗p < 0.0001; n.s., not significant. See also Figure S1. |
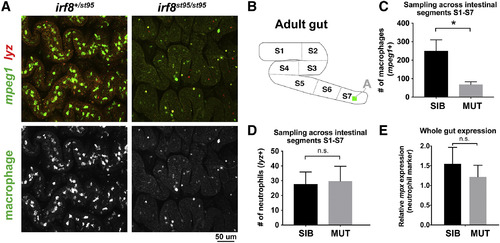
Significant Reduction of Intestinal Macrophages but No Change in Neutrophil Number in irf8−/− Mutants (A) Representative maximum intensity projections of confocal z stacks of the adult S7 intestinal region. Double transgenic irf8 mutants and siblings carrying the macrophage reporter mpeg1:GFP (green) and neutrophil reporter lyz:mCherry (red) were analyzed. (B) Schematic of the S1–S7 segmentation of the adult zebrafish intestine. The green square inside of S7 represents the approximate region where images in (A) were taken. (C) Quantification of the number of macrophages (mpeg1+) from a representation of all intestinal segments S1–S7. ∗p < 0.05. (D) Quantification of the number of neutrophils (lyz+) from a representation of all intestinal segments S1–S7. (E) qPCR analysis of neutrophil marker mpx expression shows no significant difference between irf8 mutants and siblings. 3 or more independent animals were used per mutant and sibling groups for all quantifications. Error bars show SEM. Student’s t test was used to determine statistical significance. SIB, wild-type and heterozygous siblings. |
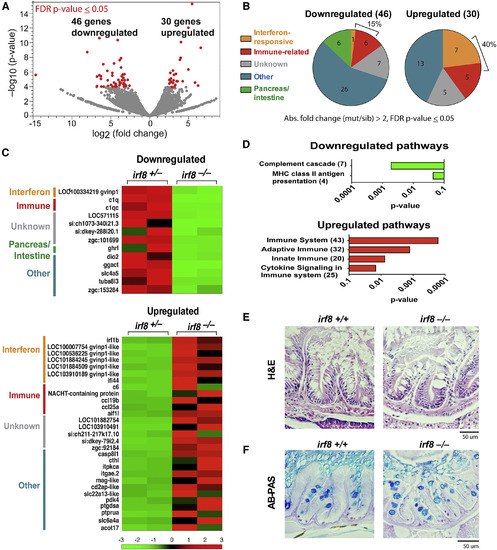
RNA-Seq Reveals Gut Transcriptomic Changes in irf8−/− Mutants but No Apparent Intestinal Structural Defects (A) Volcano plot showing fold change and the statistical significance of all genes analyzed by RNA-seq; each dot represents a different gene. Significantly altered genes with a false discovery rate (FDR) adjusted p ≤ 0.05 are highlighted in red. (B) Interferon-responsive genes and immune-related genes were prominent groups significantly altered. Unknown represents uncharacterized genes without an informative gene name. Other represents genes of diverse functions and pathways that do not belong in a common category. Pancreas and/or intestine represents genes that are known to be expressed or have functions in pancreas, intestine, or both. (C) Heatmaps listing the downregulated and upregulated genes. Two independent biological samples per genotype are represented. Color range from −3 to +3 is based on normalized fragments per kilobase of transcript per million mapped reads (FPKM) values using relative deviation per gene over all samples centered on 0. (D) Differentially expressed gene list generated from DESeq2 using a broader cutoff of a p < 0.05 was used to determine significantly changed pathways in the PANTHER database. Number of genes identified in each pathway is shown in parentheses. (E and F) Adult intestinal morphology was assessed by (E) H&E and (F) AB-PAS staining on 5-μm sections of the proximal gut regions (S1 and S2). See also Figures S4 and S5 and Table S2. |
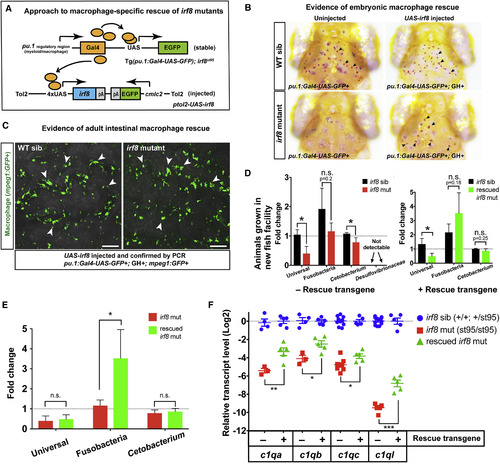
Mosaic Rescue of Macrophages in irf8−/− Mutants Is Sufficient to Restore Commensal Microbiota and Complement c1q Expressions (A) Schematic illustrating the genetic constructs used to generate rescue of macrophages in irf8 mutants. (B) In contrast to the negative controls (uninjected irf8 mutants), which have no brain macrophages, several brain macrophages (arrows) are recovered in the pu.1:Gal4-UAS-GFP+/UAS-irf8-injected embryos. (C) pu.1:Gal4-UAS-GFP+/UAS-irf8-injected embryos were raised to adulthood and were found to exhibit recovery of intestinal macrophages (arrows) in the irf8 mutant adult guts. Images show gut segment S7 visualized from the lumen side. (D) Relative abundance of gut microbes in the adult intestine was assayed by qPCR in irf8 mutants and their siblings with the rescue construct and at baseline without the rescue construct. (E) Comparison of relative bacterial levels between irf8 mutants and macrophage-rescued irf8 mutants. (F) Fold difference in target c1q genes. Irf8 mutants with the rescue construct were compared to baseline irf8 mutants (control data are represented from Figure 5A). Each symbol represents an individual animal. Scale bars show 50 μm. Statistical significance was determined by a Student’s t test. 3 or more animals per group were analyzed for all experiments. Error bars show SEM. GH, cmlc2:GFP expression (GFP+ heart). ∗p < 0.05; ∗∗p < 0.01; ∗∗∗p < 0.001. mut, mutant; sib, heterozygous or WT sibling; WT, wild-type. See also Figures S6 and S7 and Table S3. |
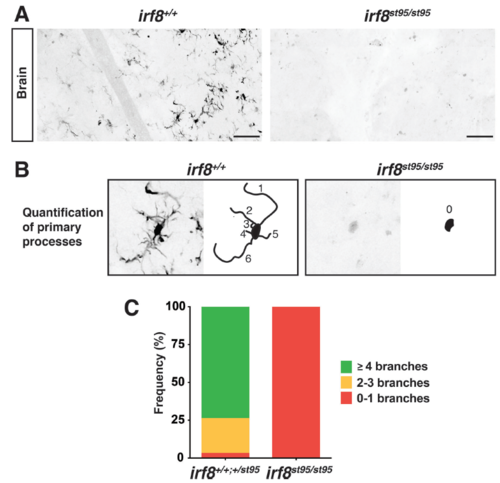
Absence of microglia in adult irf8 mutants, Related to Figure 1. A Inverted binary images of mpeg1: GFP expression in the brain of WT sibling (left panel) and irf8 mutant (right panel). WT controls harbor many microglia with complex morphologies and multiple processes in contrast to mutants which show few to no mpeg1:GFP+ cells. Scale bar is 50 μm. B Quantification of the number of primary processes of each microglia (mpeg1:GFP+ brain cell). Primary process is defined as a major cellular branch that is directly extended from the cell body. Left, a microglial cell in wildtype adjacent to its corresponding schematic of its primary processes as numerically labeled. Right, a weakly mpeg1:GFP expressing cell in irf8 mutant exhibiting no processes. C Bar chart quantifying the frequency of cells exhibiting the different number of primary processes (branches). n, number of cells analyzed, is 505 for wildtype/heterozygous siblings and 8 for irf8 mutants. |
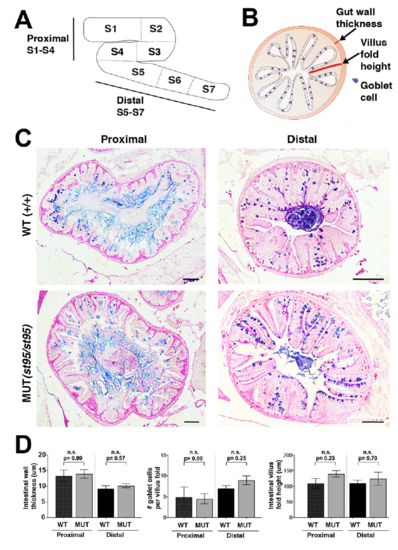
Histological analysis of the intestines does not show structural defects in irf8 mutants, Related to Figure 4. A Schematic of the adult zebrafish intestine and corresponding proximal (S1-S4) and distal (S5-S7) regions. B Schematic of quantified parameters for assessment of intestinal architecture: gut wall thickness, villus fold height, and frequency of goblet cells. C Representative images of proximal (left) and distal (right) intestinal regions stained with combined Alcian Blue and Periodic Acid-Schiff on 5 um transverse sections of irf8 wild type animals (top) and mutant animals (bottom). D Quantification of intestinal wall thickness (left), number of goblet cells per intestinal villus fold (middle) and intestinal villus fold height (right). Data were derived from n= 3 wild type siblings for proximal and distal regions, n=4 mutants for proximal region, and n=5 mutants for distal region. All scale bars represent 100 μm. Statistical significance was determined by the Mann-Whitney test. |
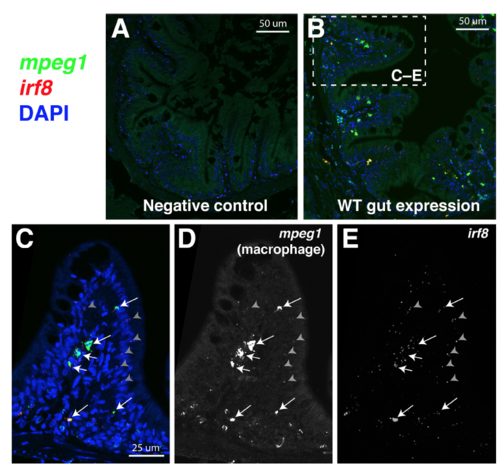
RNAscope in situ hybridization reveals restricted irf8 expression in intestinal macrophages in wild type adult zebrafish, Related to Figure 6. Representative images of 5 μm paraffin transverse sections of the adult zebrafish through the intestinal region processed for RNAscope in situ hybridization. A Negative control multiplex RNAscope staining. B Merge fluorescent image showing a cross section of the adult intestine stained for mpeg1 (FITC, green) and irf8 (Cy3, red) gene-specific RNAscope probes with DAPI (blue) as a counterstain to visualize all cells. C High magnification of dotted box region in B shows expression of irf8 in the same cells also expressing the macrophage marker mpeg1 (arrows) in an intestinal villus fold. Arrows point to macrophages positive for both probes (mpeg1+ and irf8+). Gray arrowheads show representative punctate signals also found positive for both probes (mpeg1+ and irf8+). D Grayscale image of mpeg1 (FITC) channel alone. E Grayscale image of irf8 channel (Cy3) alone. |