
|
Fig. S1
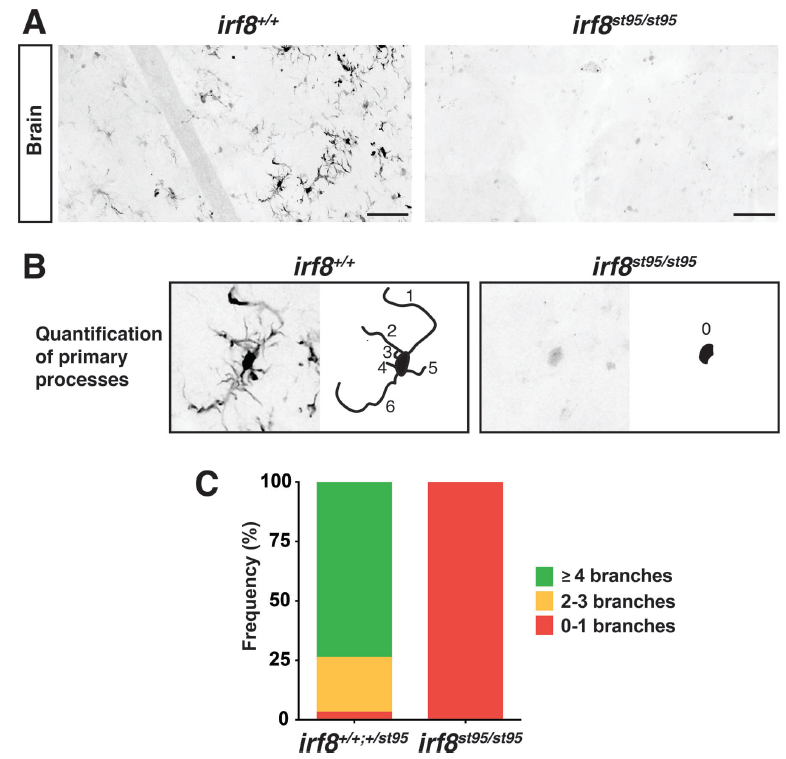
Absence of microglia in adult irf8 mutants, Related to Figure 1.
A Inverted binary images of mpeg1: GFP expression in the brain of WT sibling (left panel) and irf8 mutant (right panel). WT controls harbor many microglia with complex morphologies and multiple processes in contrast to mutants which show few to no mpeg1:GFP+ cells. Scale bar is 50 μm. B Quantification of the number of primary processes of each microglia (mpeg1:GFP+ brain cell). Primary process is defined as a major cellular branch that is directly extended from the cell body. Left, a microglial cell in wildtype adjacent to its corresponding schematic of its primary processes as numerically labeled. Right, a weakly mpeg1:GFP expressing cell in irf8 mutant exhibiting no processes. C Bar chart quantifying the frequency of cells exhibiting the different number of primary processes (branches). n, number of cells analyzed, is 505 for wildtype/heterozygous siblings and 8 for irf8 mutants.