
- Title
-
Bessel Beam Illumination Reduces Random and Systematic Errors in Quantitative Functional Studies Using Light-Sheet Microscopy
- Authors
- Müllenbroich, M.C., Turrini, L., Silvestri, L., Alterini, T., Gheisari, A., Vanzi, F., Sacconi, L., Pavone, F.S.
- Source
- Full text @ Front. Cell. Neurosci.
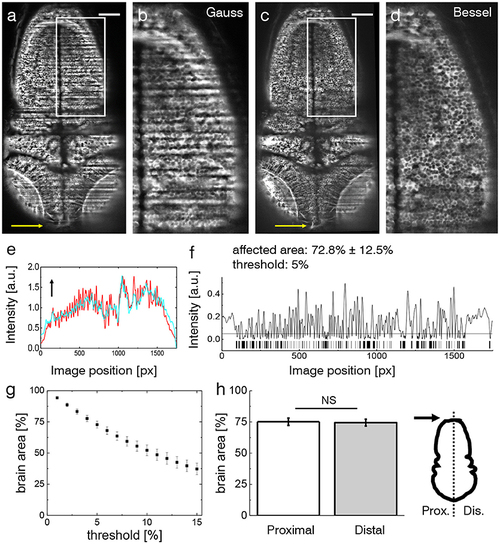
Shadow artifacts in zebrafish imaging. (a,c) Static shadows in the encephalon of a 3 dpf Tg(elavl3:GCaMP6s) zebrafish with cytoplasmatic expression of GCaMP imaged with Gaussian and Bessel beam illumination. Yellow arrow indicates light-sheet propagation. Scale bar: 100 μm. (b,d) Details showing the hindbrain. The contrast in both images has been enhanced over the entire image using Contrast-Limited Adaptive Histogram Equalization (CLAHE) in ImageJ for better visualization. (e) Normalized line profile averaged over the entire width of the image for Gaussian (red) and Bessel beam illumination (cyan) evidences the shadows as drops in the red curve. Arrow indicates light-sheet propagation. (f) Absolute difference of the line profiles in (e) and the resulting bar code when applying a threshold of 5 %. With this threshold 72.8 ± 12.5 % (error is standard deviation, n = 20 planes throughout the encephalon in N = 11 larvae) was affected by streaking artifacts. (g) Sensitivity of the affected area on the threshold. Each point is the average of n = 20 planes in N = 11 larvae, error is standard error of the mean (sem). (h) The difference between the half of the larva proximal and distal to the light-sheet source is not statistically significant (p = 0.6467, paired t-test of n = 20 planes in N = 11 larvae, error is sem). |
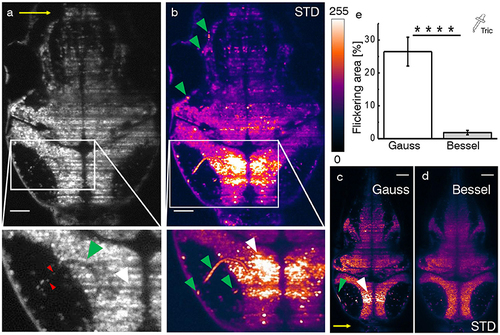
Hemodynamic flickering in zebrafish imaging. (a) Transverse plane of a 4dpf Zebrafish larva [Tg(elavl3:H2B-GCaMP6s)]. Red blood cells (red arrow heads) passing through vasculature (green arrow head) dynamically absorb or scatter the excitation light sheet (yellow arrow) and create areas of strongly fluctuating shadow artifacts (white arrow head). Scale bar: 50 μm. (b) Projection of the standard deviation over ≈ 100 ms of a time lapse recording on the plane shown in (a). Each of the three segments of vasculature (green arrow heads, inset) causes a corresponding area of high standard deviation of the fluorescence intensity (white arrow head). A look-up table has been applied for clarity ranging from 0 (black) to 255 (white) for the 8-bit gray pixel value. (c,d) Displayed on the same brightness scale, corresponding flickering is much reduced with Bessel beam illumination. (e) Quantification of 2D area strongly affected by flickering for Gaussian (23.8 ± 6.5 %) and and Bessel beam illumination (0.8 ± 0.5 %) (****p ≤ 0.0001, paired t-test of n = 18 planes in N = 10 larvae aged 4–5 dpf, error is sem). Tricaine (160 mg l-1) was added to the fish water. |
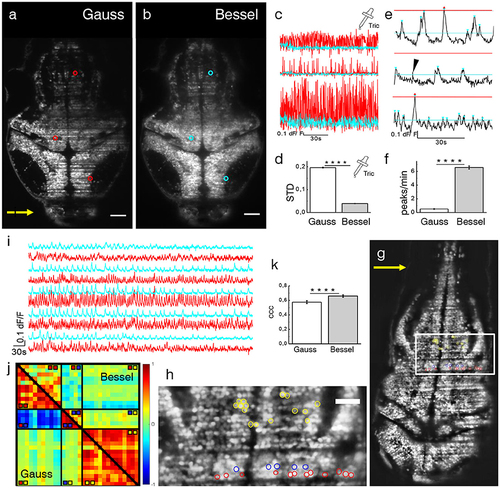
Ca2+-imaging. Transverse plane of a 4 dpf elavl3:H2B-GCaMP6s larva imaged with Gaussian (a) and Bessel beam illumination (b). Scale bar is 50 μm. Yellow arrow indicates direction of light sheet. Indicated are three exemplary cells with red (cyan) circles which have been illuminated with a Gaussian (Bessel) beam and whose traces can be seen in (c). (d) Mean standard deviation (STD) of traces without neuronal activity (p < 0.0001, paired t-test, n = 625 cells in N = 7, error is sem). (e) Exemplary dF/F traces measured with Bessel beam illumination during neuronal activity. Indicated are peaks (triangles) above the noise level for Gaussian (red) and Bessel beam illumination (cyan). Peaks with prominence below threshold were discarded (black arrow head). (f) Peaks per minute detected above noise level using appropriate thresholding to exclude Gaussian and Bessel baseline noise (p < 0.0001, paired t-test, n = 586, in N = 1 larva, error is sem). (g) Transverse plane of a 4dpf larva imaged with Gaussian illumination. Indicated are cells located on two adjacent excitation lines (red, blue) and randomly in the hindbrain as part of an active network (yellow, see also zoomed view in h). (i) Exemplary traces of cells (marked yellow in h) measured with Gaussian (red) and Bessel beam illumination (cyan). (j) Correlation matrix of cells measured with Gaussian (lower triangular) and Bessel beam illumination (upper triangular matrix). The color scale ranges from –1 (blue) to +1 (red). (k) Averaged coefficient of cross correlations (ccc) of yellow yellow quadrant (p < 0.0001, paired t-test, n = 91, N = 1, error is sem). |
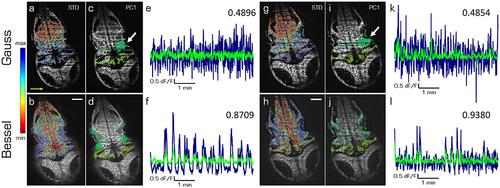
Principal components of spontaneous activity in the hindbrain and the cerebellum. Transverse planes of a 5dpf elavl3:H2B-GCaMP6s larva imaged with Gaussian (top) and Bessel illumination (bottom row) at two different depth (left and right half). Scale bar is 50 μm. Yellow arrow indicates direction of light sheet. (a,b,g,h) Standard deviation of the mean correlation to every other cell color-coded from blue (maximum) to red (minimum). (c,d,i,j) Indicate the 10 % of cells most contributing to the first principal component in the hindbrain and cerebellum respectively. (e,f,k,l) Time traces of the first principal component of the hindbrain (navy) and the cerebellum (light green) and the correlation between both traces (top right). |