
|
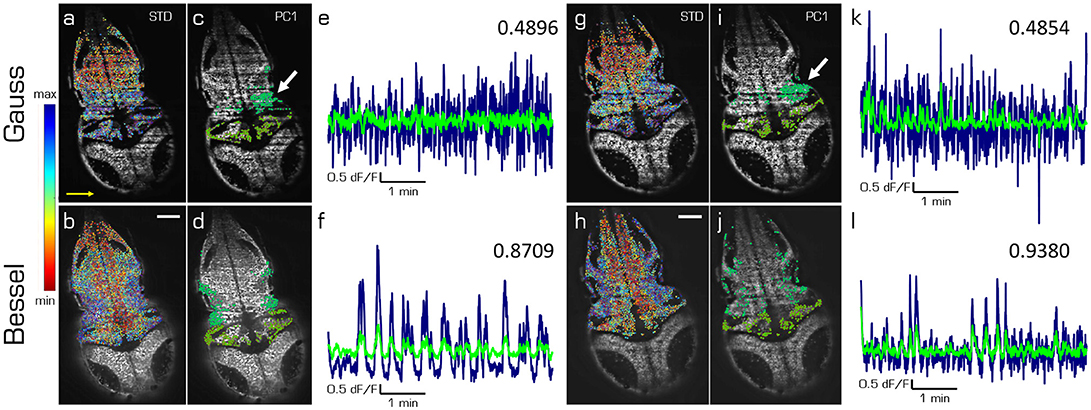
Fig. 5
Principal components of spontaneous activity in the hindbrain and the cerebellum. Transverse planes of a 5dpf elavl3:H2B-GCaMP6s larva imaged with Gaussian (top) and Bessel illumination (bottom row) at two different depth (left and right half). Scale bar is 50 μm. Yellow arrow indicates direction of light sheet. (a,b,g,h) Standard deviation of the mean correlation to every other cell color-coded from blue (maximum) to red (minimum). (c,d,i,j) Indicate the 10 % of cells most contributing to the first principal component in the hindbrain and cerebellum respectively. (e,f,k,l) Time traces of the first principal component of the hindbrain (navy) and the cerebellum (light green) and the correlation between both traces (top right).