
|
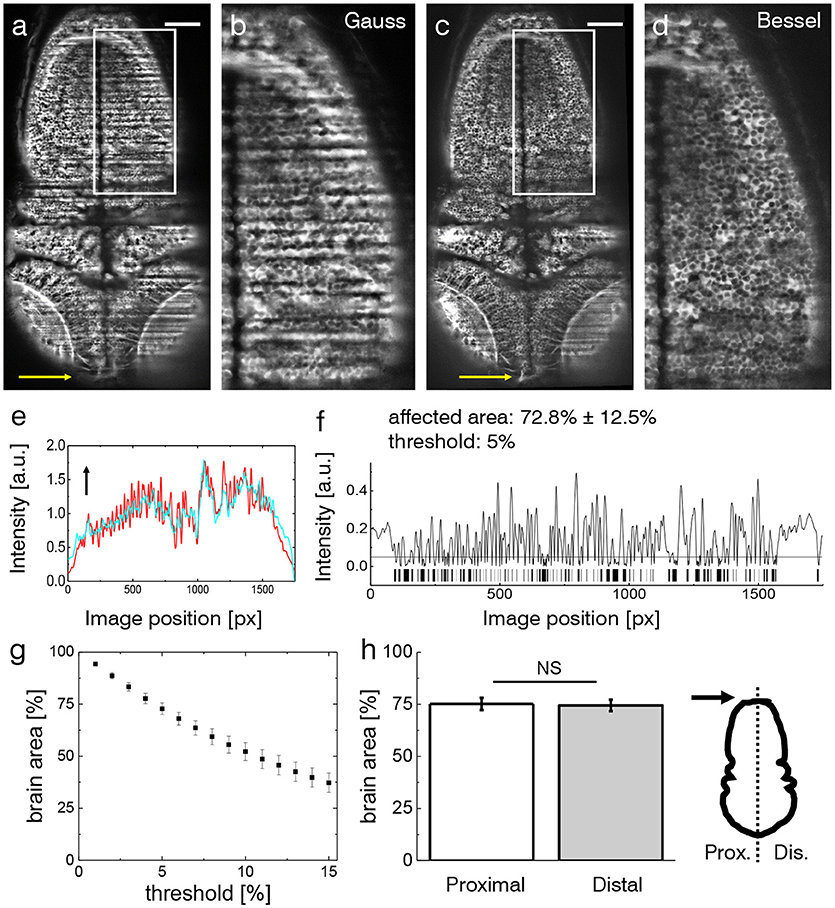
Fig. 2
Shadow artifacts in zebrafish imaging. (a,c) Static shadows in the encephalon of a 3 dpf Tg(elavl3:GCaMP6s) zebrafish with cytoplasmatic expression of GCaMP imaged with Gaussian and Bessel beam illumination. Yellow arrow indicates light-sheet propagation. Scale bar: 100 μm. (b,d) Details showing the hindbrain. The contrast in both images has been enhanced over the entire image using Contrast-Limited Adaptive Histogram Equalization (CLAHE) in ImageJ for better visualization. (e) Normalized line profile averaged over the entire width of the image for Gaussian (red) and Bessel beam illumination (cyan) evidences the shadows as drops in the red curve. Arrow indicates light-sheet propagation. (f) Absolute difference of the line profiles in (e) and the resulting bar code when applying a threshold of 5 %. With this threshold 72.8 ± 12.5 % (error is standard deviation, n = 20 planes throughout the encephalon in N = 11 larvae) was affected by streaking artifacts. (g) Sensitivity of the affected area on the threshold. Each point is the average of n = 20 planes in N = 11 larvae, error is standard error of the mean (sem). (h) The difference between the half of the larva proximal and distal to the light-sheet source is not statistically significant (p = 0.6467, paired t-test of n = 20 planes in N = 11 larvae, error is sem).