
|
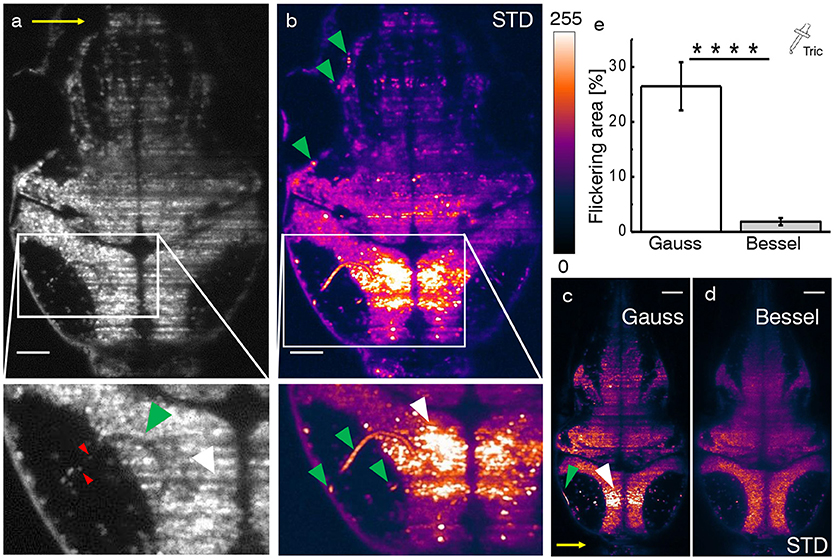
Fig. 3
Hemodynamic flickering in zebrafish imaging. (a) Transverse plane of a 4dpf Zebrafish larva [Tg(elavl3:H2B-GCaMP6s)]. Red blood cells (red arrow heads) passing through vasculature (green arrow head) dynamically absorb or scatter the excitation light sheet (yellow arrow) and create areas of strongly fluctuating shadow artifacts (white arrow head). Scale bar: 50 μm. (b) Projection of the standard deviation over ≈ 100 ms of a time lapse recording on the plane shown in (a). Each of the three segments of vasculature (green arrow heads, inset) causes a corresponding area of high standard deviation of the fluorescence intensity (white arrow head). A look-up table has been applied for clarity ranging from 0 (black) to 255 (white) for the 8-bit gray pixel value. (c,d) Displayed on the same brightness scale, corresponding flickering is much reduced with Bessel beam illumination. (e) Quantification of 2D area strongly affected by flickering for Gaussian (23.8 ± 6.5 %) and and Bessel beam illumination (0.8 ± 0.5 %) (****p ≤ 0.0001, paired t-test of n = 18 planes in N = 10 larvae aged 4–5 dpf, error is sem). Tricaine (160 mg l-1) was added to the fish water.