
- Title
-
Glucocorticoid deficiency causes transcriptional and post-transcriptional reprogramming of glutamine metabolism
- Authors
- Weger, M., Weger, B.D., Görling, B., Poschet, G., Yildiz, M., Hell, R., Luy, B., Akcay, T., Güran, T., Dickmeis, T., Müller, F., Krone, N.
- Source
- Full text @ EBioMedicine

ZFIN is incorporating published figure images and captions as part of an ongoing project. Figures from some publications have not yet been curated, or are not available for display because of copyright restrictions. |
|
ZFIN is incorporating published figure images and captions as part of an ongoing project. Figures from some publications have not yet been curated, or are not available for display because of copyright restrictions. PHENOTYPE:
|
|
ZFIN is incorporating published figure images and captions as part of an ongoing project. Figures from some publications have not yet been curated, or are not available for display because of copyright restrictions. |
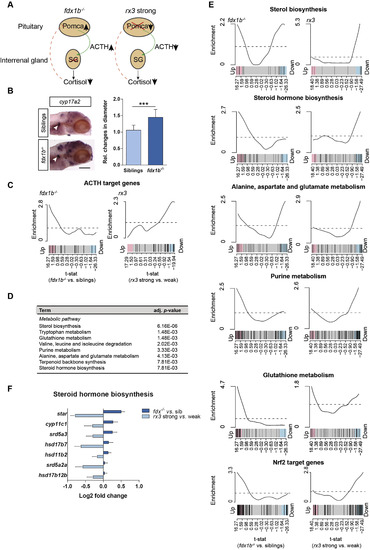
fdx1b−/− mutant larvae exhibit hallmarks of primary adrenal insufficiency and differ from rx3 strong mutant larvae reminiscent to secondary adrenal insufficiency. (A) Schematic shows the different alterations in the pituitary and interrenal gland axis of fdx1b−/− and rx3 strong mutant larvae. Abbreviations: Pomca, pro-opiomelanocortin; ACTH, adrenocorticotropin; SG, steroidogenesis. (B) Whole-mount in situ hybridization of cyp17a2 to visualize the interrenal gland (arrow) in fdx1b−/− mutant larvae (n = 17) and wild-type siblings (n = 11) at 120 hpf stage. Bar plot shows the relative (rel.) changes in the diameter of the interrenal gland size. (C) Barcode plots for ACTH target genes in fdx1−/− mutant larvae (left) and rx3 strong mutant larvae (right). The two mutant types show opposing directions in the gene set enrichment (p-value = 1.7 E−04) for gene set enrichment analysis. (D) Gene set enrichment analysis of differentially expressed genes showing different regulation between fdx1b−/− and rx3 strong. (E) Barcode plots for metabolic pathways and Nrf2 target genes in fdx1b−/− mutant larvae (left) and rx3 strong mutant larvae (right) in comparison to the corresponding control (wild-type siblings or rx3 weak). (F) Fold changes of differentially expressed genes in steroid hormone biosynthesis between mutant larvae and their corresponding controls. The data for the rx3 mutants is a reanalysis from our previously published data set [74]. Scale bar = 110 μm. *, p < .05, **, p < .01, ***, p < .001. |
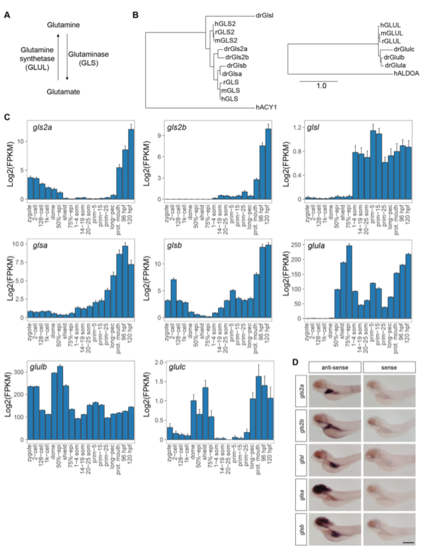
Glutamine metabolism in vertebrates. (A) Schematic illustrates glutamate metabolism in humans. (B) Phylogenetic analysis of the glutamine synthetase (GLUL) and glutaminase (GLS, GLS2) proteins in human (h), mouse (m), rat (r) and zebrafish (dr). Aminoacylase 1 (ACY1) and aldolase A (ALDOA) were used as outgroups. (C) Reanalysis of a previously published RNA-seq study (1) showing expression of the zebrafish glutaminases (gls2a, gls2b, gls3, glsa, glsb) and glutamine synthetase genes (glula, glulb, glulc) in wild-type embryos/larvae during development. Abbreviations: epi, epiboly; som, somites; prim, primordium; prot, protruding; hpf, hours post-fertilization. (D) Whole-mount in situ hybridization of the glutaminase transcripts (gls2a, gls2b, gls3, glsa, glsb) in wild-type larvae at 120 hpf. Images are a representative example of the whole-mount in situ hybridization stainings (n = 20). Scale-Bar: 0.2 mm. |
|
ZFIN is incorporating published figure images and captions as part of an ongoing project. Figures from some publications have not yet been curated, or are not available for display because of copyright restrictions. |
|
ZFIN is incorporating published figure images and captions as part of an ongoing project. Figures from some publications have not yet been curated, or are not available for display because of copyright restrictions. |