
- Title
-
Macrophages inhibit Aspergillus fumigatus germination and neutrophil-mediated fungal killing
- Authors
- Rosowski, E.E., Raffa, N., Knox, B.P., Golenberg, N., Keller, N.P., Huttenlocher, A.
- Source
- Full text @ PLoS Pathog.
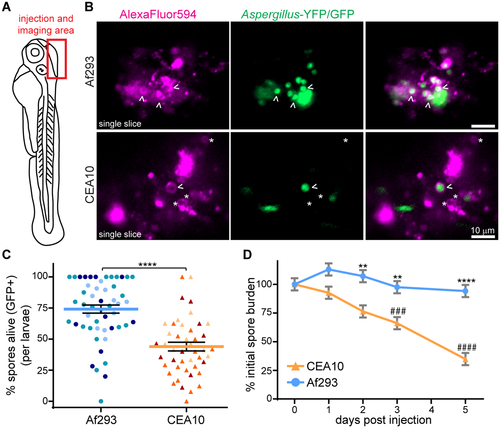
A CEA10-derived strain is killed more than an Af293-derived strain in vivo. A. Schematic of 2 dpf zebrafish larvae. Area of Aspergillus spore injection (hindbrain) and imaging is indicated. B, C. TBK1.1 (Af293) or TFYL49.1 (CEA10) spores express YFP or GFP and have AlexaFluor594 conjugated to the spore cell wall. 2 dpi larvae were imaged and the percentage of spores killed (GFP+/total) was quantified. Representative images of single z slices (B) and quantification over three experiments (C) are shown. Arrowheads indicate alive spores, asterisks indicate killed spores. Scale bar represents 10 μm. Each symbol represents one larvae, color-coded by experiment. Lines represent lsmeans ± SEM. Af293 n = 51, CEA10 n = 45. D. Fungal burden was monitored by CFU platings from single homogenized larvae infected with TBK1.1 (Af293) or TFYL49.1 (CEA10). CFUs from 24 larvae (3 replicates, 8 larvae each) per condition per day were measured. Average injection CFUs: Af293 = 150, CEA10 = 140. For all analyses, data represent lsmeans ± SEM from three pooled experiments, P values calculated by ANOVA. Asterisks represent significance between strains, # represent significance compared to day 0. See also S1 Fig. |

Inflammatory activation is required for clearance of a CEA10-derived strain. A, B. NF-κB RE:EGFP larvae were infected with non-fluorescent TJW55.2 (Af293) or CEA17 KU80Δ (CEA10) spores and imaged 2 dpi. Representative images (A) and quantification from three pooled experiments (B) are shown. Scale bar represents 50 μm. CEA10 n = 22; Af293 n = 26. C. Larvae were treated with dexamethasone (DEX) or ethanol (EtOH) vehicle control directly after infection with TFYL81.5 (Af293) or TFYL49.1 (CEA10), and larval survival was monitored. Average injection CFUs: Af293 = 34, CEA10 = 33. D-F. myd88-/- or control larvae were infected with TBK1.1 (Af293) or TFYL49.1 (CEA10) and larval survival and/or fungal burden was monitored. Fungal burden was determined by CFU platings from single homogenized larvae. Asterisks represent significance between myd88-/- and control larvae, # represent significance compared to day 0. Average injection CFUs: D, F: Af293 = 27, CEA10 = 32; E: Af293 = 66. For all analyses, data represent 3 pooled replicates. For CFU experiments, CFUs from 24 larvae (8 larvae per replicate) per condition per day were measured. Intensity values and CFU analyses represent lsmeans ± SEM from three pooled experiments, P values calculated by ANOVA. P values for survival analyses calculated by Cox proportional hazard regression analysis. See also S2 Fig. |
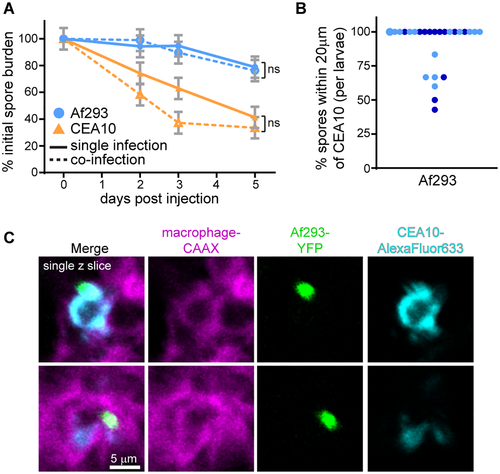
CEA10-induced inflammatory activation is not sufficient for killing of an Af293-derived strain. A. Fungal burden was monitored by CFU platings from single homogenized larvae infected either singly with TFYL49.1 (CEA10) or TBK5.1 (Af293) or co-infected with both strains. Average injection CFUs: Af293 = 53, CEA10 = 47, co-infection = 21 Af293 + 27 CEA10. CFUs from 24 larvae (8 larvae per replicate) per condition per day were measured; lsmeans ± SEM are shown from three pooled experiments, P values calculated by ANOVA. B, C. Macrophage-membrane labeled larvae (mfap4:tomato-CAAX) were co-infected with YFP-expressing TBK1.1 (Af293) and AlexaFluor633-labeled CEA17 KU80Δ (CEA10) and imaged 1 dpi. Percentage of Af293 spores within 20 μm of a CEA10 spore in each larvae from two replicates was quantified (B). Each point represents one larvae, color-coded by replicate. Single z-slice images from a representative larvae (C) are shown. Scale bar represents 5 μm. See also S3 Fig. |
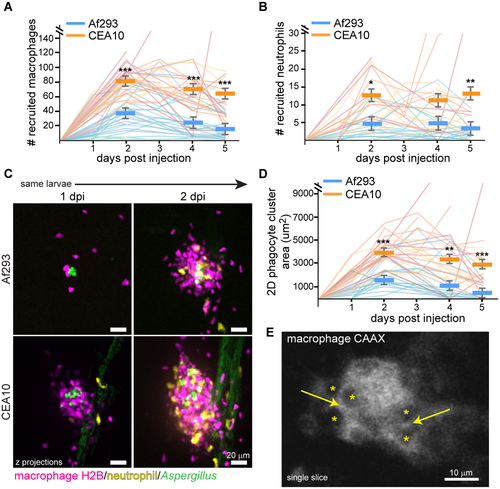
Macrophages form tight clusters around A. fumigatus. A-D. Dual macrophage-nuclear (mpeg1:mcherry-H2B) and neutrophil (lyz:BFP) labeled larvae were infected with YFP- or GFP-expressing A. fumigatus TBK1.1 (Af293) or TFYL49.1 (CEA10) strains and imaged days 1–5 post injection. Macrophage (A) and neutrophil (B) recruitment as well as phagocyte cluster size (D) were quantified. Representative images (C, scale bar represents 20 μm) and pooled quantification from 3 experiments (A, B, D) are shown. Each line in graphs represents one larvae followed for the entire course of infection, lines are color-coded by replicate, bars represent pooled lsmeans ± SEM, P values calculated by ANOVA. Af293 n = 25, CEA10 n = 27 for macrophage and cluster area quantification; Af293 n = 17, CEA10 n = 18 for neutrophil quantification. E. Macrophage-membrane (mfap4:tomato-CAAX) labeled larvae were infected with CEA17 KU80Δ (CEA10) and imaged 3 dpi. Asterisks represent cell nuclei, arrows indicate cell-cell junctions. Scale bar represents 10 μm. See also S4 Fig. |
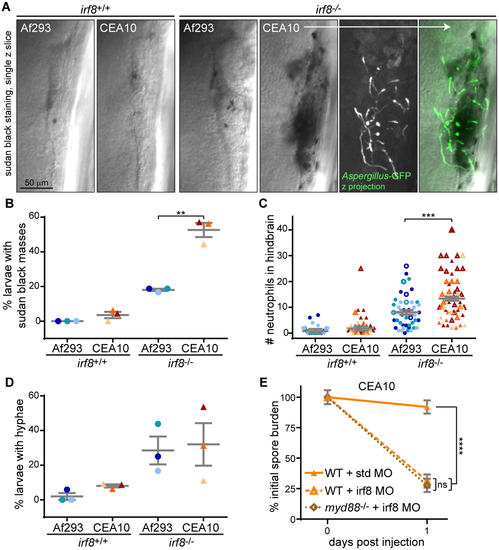
More neutrophils are recruited to a CEA10-derived strain than an Af293-derived strain in the absence of macrophages. A-D. Macrophage-deficient (irf8-/-) or control (irf8+/+) larvae were infected with YFP- or GFP-expressing A. fumigatus TBK1.1 (Af293) or TFYL49.1 (CEA10) strains, fixed 1 dpi, and stained for neutrophils (sudan black). Representative images are shown (A, scale bar represents 50 μm) and percent of larvae per experiment with sudan black masses (B), number of neutrophils at infection site (C), and percent of larvae per experiment with A. fumigatus hyphae (D) were quantified. N>9 larvae each condition each replicate. For percentage of larvae with sudan black masses or hyphae (B, D), each symbol represents one replicate, bars represent means ± SEM, P values calculated by t test. For neutrophil number quantification (C), each symbol represents one larvae. Larvae with sudan black masses where neutrophil numbers were difficult to count and represent underestimations are denoted with open symbols. Bars represent lsmeans ± SEM from 3 pooled replicates, P values calculated by ANOVA. All symbols are color-coded by replicate. E. Wild-type or myd88-/- embryos were injected with control (std) or macrophage-depleting (irf8) morpholinos. Larvae were then infected with TFYL49.1 (CEA10) spores and CFUs were measured. Average injection CFUs = 38. CFU data represent lsmeans ± SEM of 3 pooled replicates, n = 24 larvae (3 replicates, 8 larvae each) per condition per day, P values calculated with ANOVA. See also S7 Fig. |
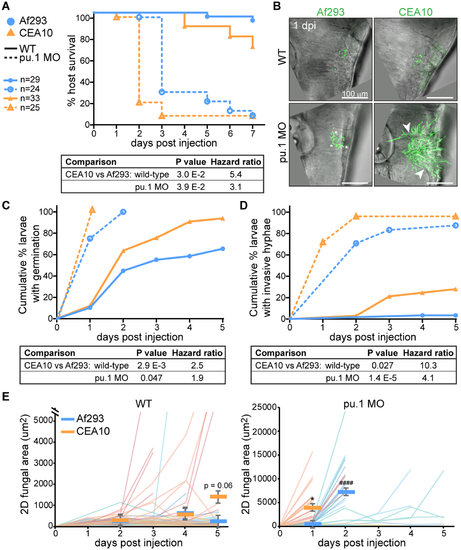
A CEA10-derived strain germinates faster than an Af293-derived strain in vivo. Wild-type or phagocyte-deficient (pu.1 morpholino) larvae were infected with YFP- or GFP-expressing A. fumigatus TBK1.1 (Af293) or TFYL49.1 (CEA10). All graphs represent data from 3 pooled replicates, Ns and labels noted in (A) are applicable for all data. A. Larval survival was monitored, P values calculated by Cox proportional hazard regression analysis. B-E. Larvae were imaged days 1–5 post injection and fungal growth was measured. Representative z-projection images 1 dpi are shown (B). Scale bar represents 100 μm. Asterisks indicate examples of germinated spores, arrowheads indicate examples of invasive hyphae. Cumulative percent of larvae with germinated spores (C) and with invasive hyphae (D) was calculated, P values were calculated by Cox proportional hazard regression analysis. 2D GFP+ fungal area was measured from maximum intensity projection images of individual larvae for 5 days of infection (or until larvae succumbed) (E). Each line represents one larvae followed for the entire course of infection, lines are color-coded by replicate, bars represent pooled lsmeans ± SEM, P values were calculated by ANOVA. See also S8 Fig. |
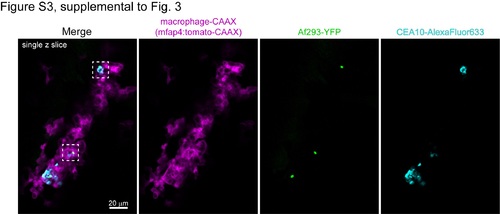
Af923- and CEA10-derived spores co-localize when co-injected. Macrophage-membrane labeled larvae (mfap4:tomato-CAAX) were co-infected with YFP-expressing TBK1.1 (Af293) and AlexaFluor633-labeled CEA17 KU80Δ (CEA10) and imaged 1 dpi. A single z-slice image containing the entire hindbrain region of a representative larvae is shown. Scale bar represents 20 μm. Boxes indicate regions shown at higher magnification in Fig 3C. |
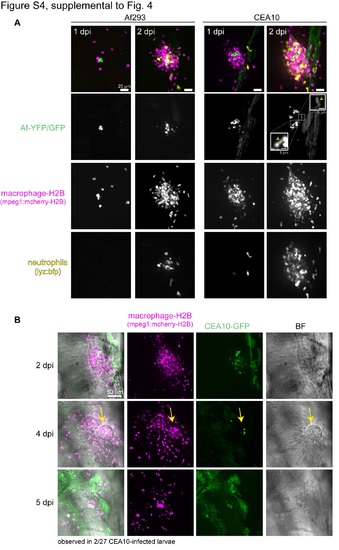
Imaging of phagocyte clusters. A. Individual channels of images from Fig 4C are shown. Representative z projection images of dual macrophage-nuclear (mpeg1:mcherry-H2B) and neutrophil (lyz:BFP) labeled larvae infected with YFP- or GFP-expressing A. fumigatus TBK1.1 (Af293) or TFYL49.1 (CEA10) strains and imaged days 1 and 2 post injection. Scale bar represents 20 μm, inset scale bar represents 5 μm. Examples of spore germination inside the cluster are marked in insets with arrowheads. B. Nuclear macrophage labeled larvae (mpeg1:mcherry-H2B) were infected with GFP-expressing TFYL49.1 (CEA10). Z-projection (mcherry, GFP) or single slice (BF) images of the same larvae on days 2, 4, and 5 dpi are shown. Extrusion at 4 dpi is marked with an arrow. Scale bar represents 50 μm. |
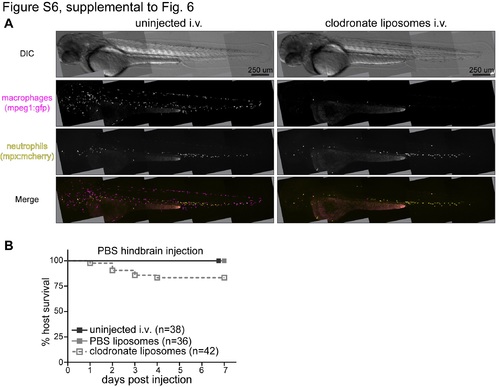
Clodronate liposomes specifically deplete macrophages. A. Dual macrophage (mpeg1:GFP) and neutrophil (mpx:mCherry) labeled larvae were injected with clodronate liposomes, or left uninjected, and imaged 24 hours later. Z-projection (GFP, mcherry) or single slice (BF) images are shown. Scale bar represents 250 μm. B. PBS was injected into the hindbrains of clodronate liposome-injected or control (PBS liposomes and/or uninjected i.v.) larvae and survival was monitored. Data shown are from 3 pooled replicates. |
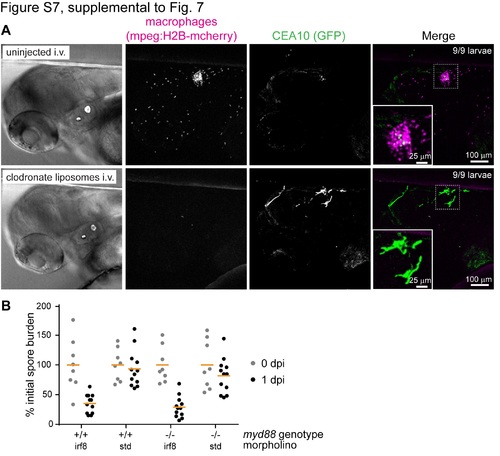
Macrophage depletion leads to more germination and clearance of a CEA10-derived strain. A. Macrophage-depleted (clodronate liposomes) or control (uninjected i.v.) larvae were infected with GFP-expressing TFYL49.1 (CEA10) and imaged 1 dpi. Z-projection (mcherry, GFP) or single slice (BF) images shown are representative of 9/9 larvae from each condition from one experiment. Scale bar represents 100 μm or 25 μm (inset). B. Wild-type or myd88-/- embryos were injected with control (std) or macrophage-depleting (irf8) morpholinos. Larvae were then infected with TFYL49.1 (CEA10) spores and CFUs were measured. Data are from one experiment, each symbol represents one larva. These data are also included in the pooled data from three replicates shown in Fig 7E. |
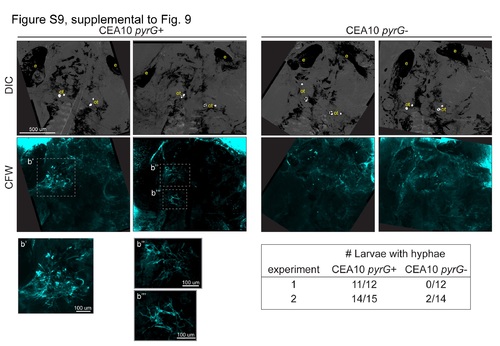
pyrG- strains are deficient in germination in larval zebrafish. Phagocyte-deficient larvae (pu.1 morphant) were infected with non-fluorescent spores of CEA17 KU80Δ (CEA10 pyrG+) or CEA17 (CEA10 pyrG-). 1 dpi A. fumigatus growth was visualized in flattened larvae with calcofluor white (CFW) staining and representative widefield images are shown. e = eye, ot = otic vesicle. Number of larvae with hyphal growth in 2 replicates was quantified. |