
|
Fig. S4
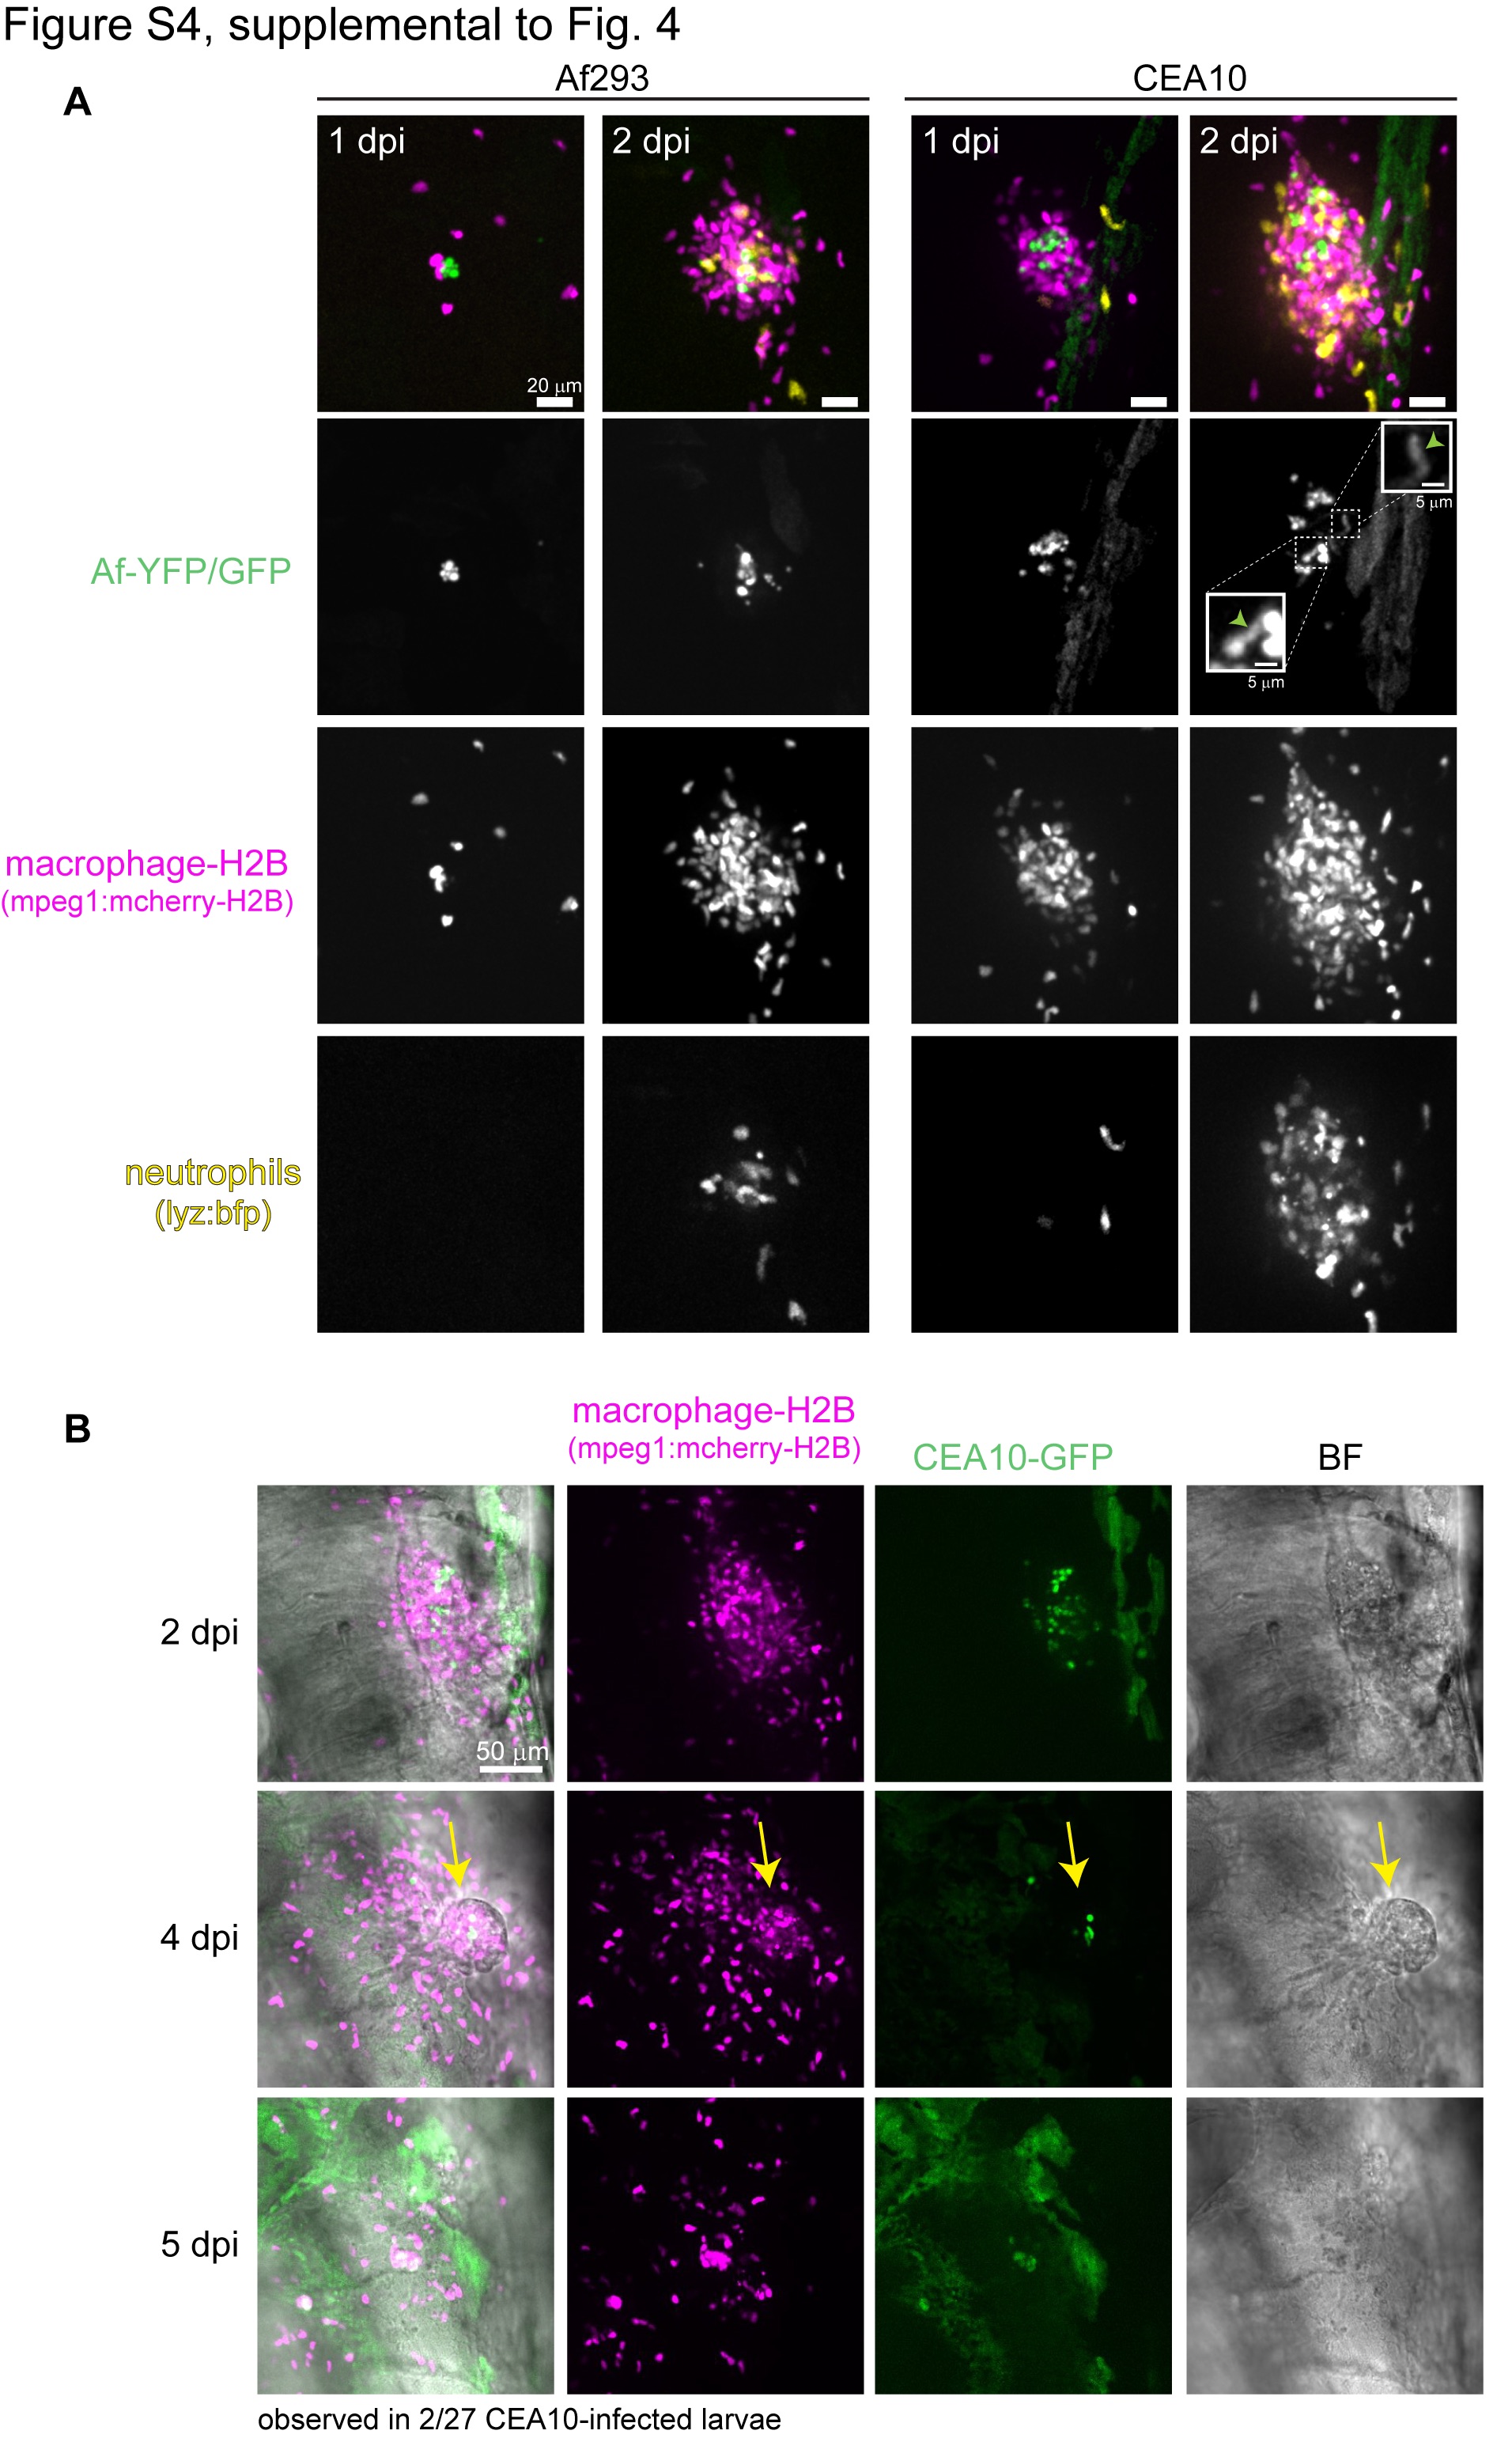
Imaging of phagocyte clusters.
A. Individual channels of images from Fig 4C are shown. Representative z projection images of dual macrophage-nuclear (mpeg1:mcherry-H2B) and neutrophil (lyz:BFP) labeled larvae infected with YFP- or GFP-expressing A. fumigatus TBK1.1 (Af293) or TFYL49.1 (CEA10) strains and imaged days 1 and 2 post injection. Scale bar represents 20 μm, inset scale bar represents 5 μm. Examples of spore germination inside the cluster are marked in insets with arrowheads. B. Nuclear macrophage labeled larvae (mpeg1:mcherry-H2B) were infected with GFP-expressing TFYL49.1 (CEA10). Z-projection (mcherry, GFP) or single slice (BF) images of the same larvae on days 2, 4, and 5 dpi are shown. Extrusion at 4 dpi is marked with an arrow. Scale bar represents 50 μm.