
Fig. 8
- ID
- ZDB-IMAGE-180918-16
- Publication
- Rosowski et al., 2018 - Macrophages inhibit Aspergillus fumigatus germination and neutrophil-mediated fungal killing
- All Figures
- Figures for Rosowski et al., 2018
|
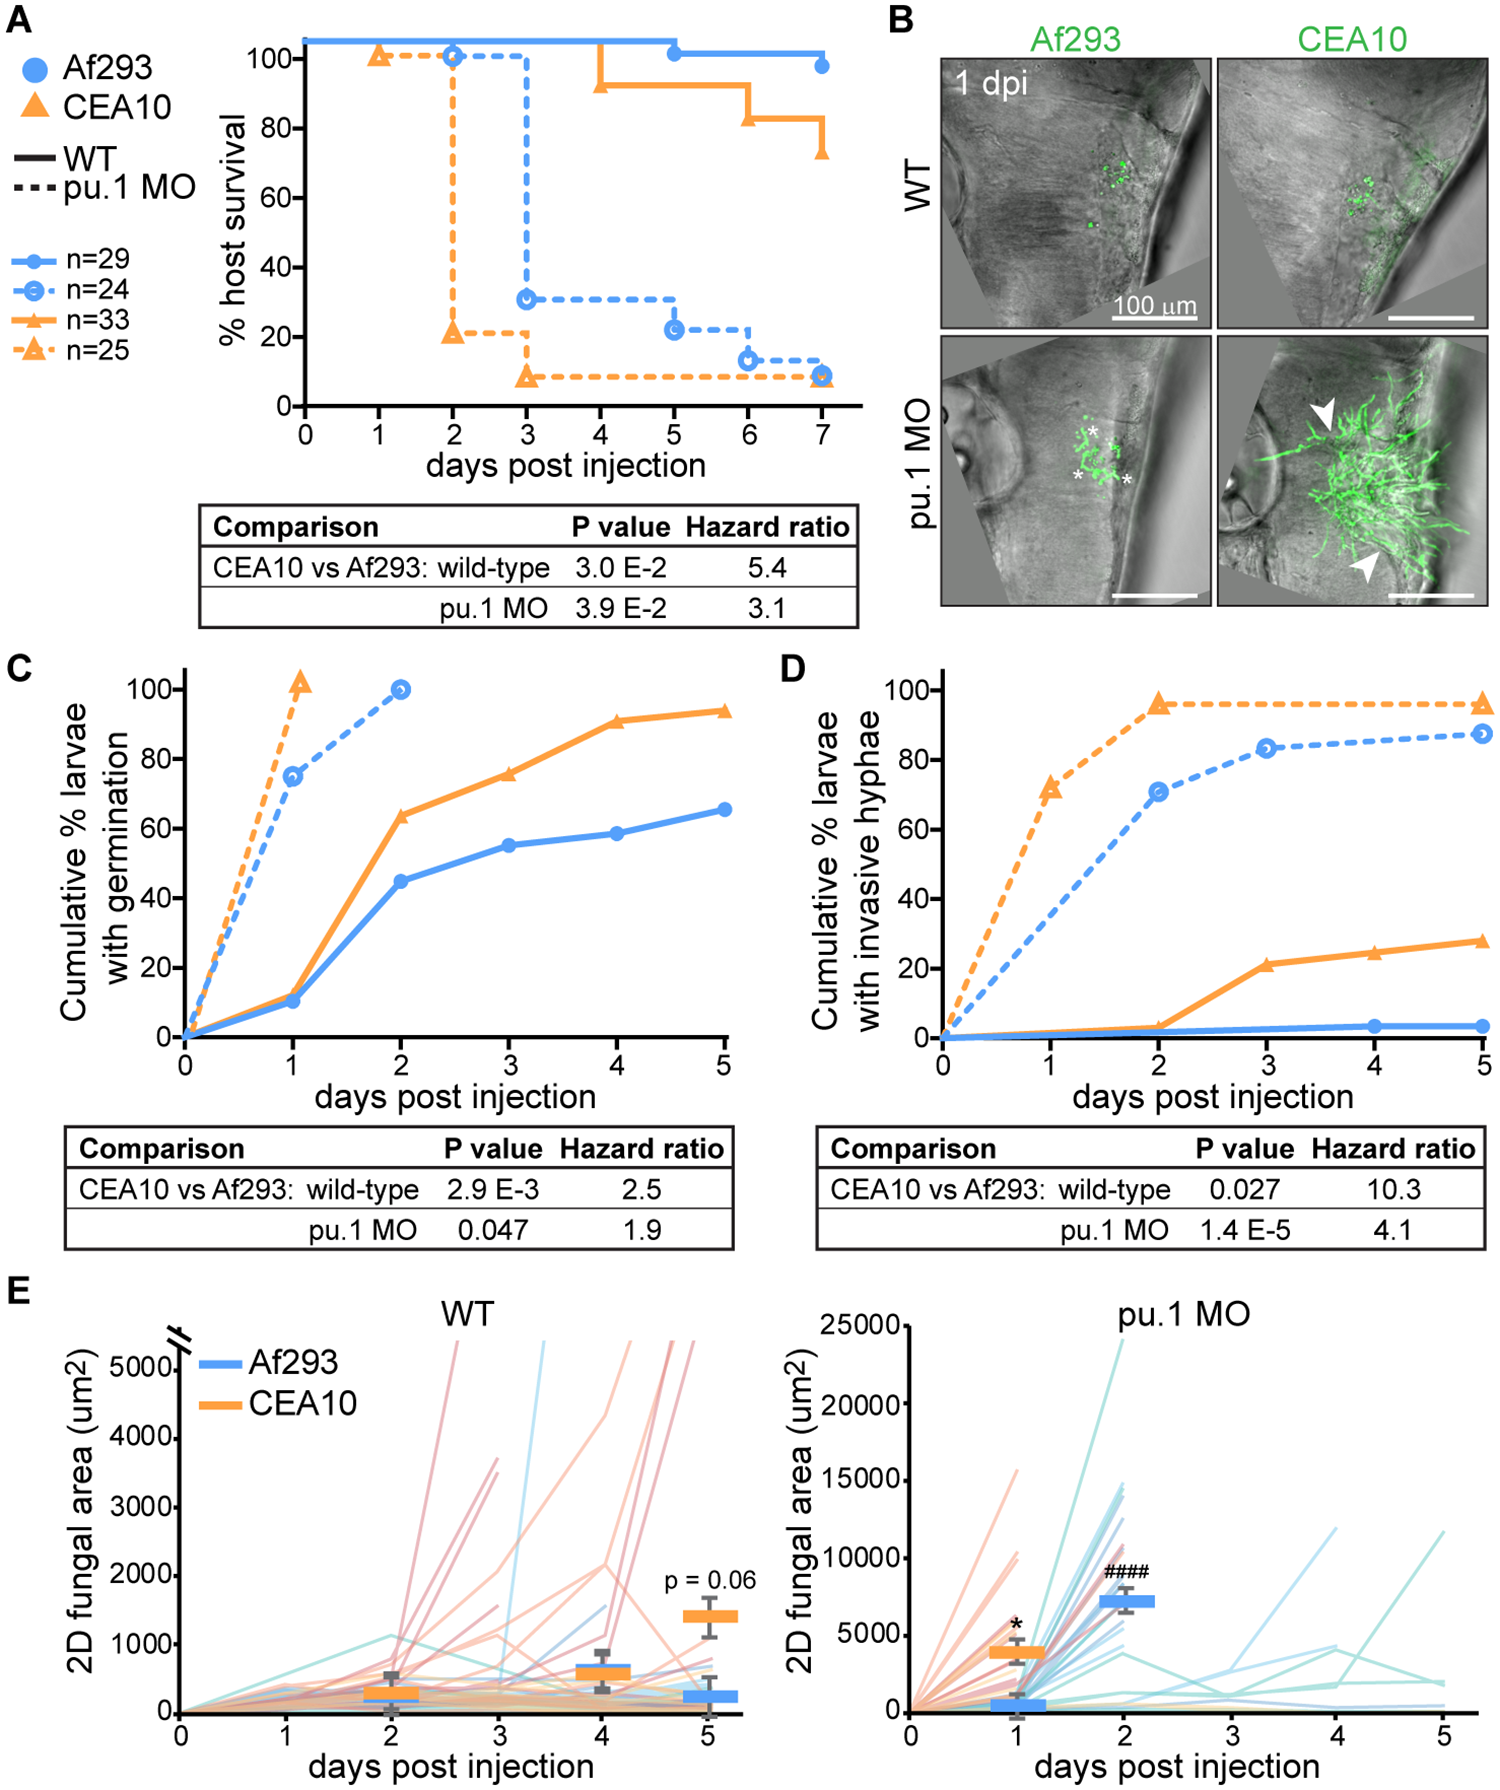
Fig. 8
A CEA10-derived strain germinates faster than an Af293-derived strain in vivo.
Wild-type or phagocyte-deficient (pu.1 morpholino) larvae were infected with YFP- or GFP-expressing A. fumigatus TBK1.1 (Af293) or TFYL49.1 (CEA10). All graphs represent data from 3 pooled replicates, Ns and labels noted in (A) are applicable for all data. A. Larval survival was monitored, P values calculated by Cox proportional hazard regression analysis. B-E. Larvae were imaged days 1–5 post injection and fungal growth was measured. Representative z-projection images 1 dpi are shown (B). Scale bar represents 100 μm. Asterisks indicate examples of germinated spores, arrowheads indicate examples of invasive hyphae. Cumulative percent of larvae with germinated spores (C) and with invasive hyphae (D) was calculated, P values were calculated by Cox proportional hazard regression analysis. 2D GFP+ fungal area was measured from maximum intensity projection images of individual larvae for 5 days of infection (or until larvae succumbed) (E). Each line represents one larvae followed for the entire course of infection, lines are color-coded by replicate, bars represent pooled lsmeans ± SEM, P values were calculated by ANOVA. See also S8 Fig.